

FALLING THROUGH THE NET:
TOWARD DIGITAL INCLUSION
A Report on Americans' Access to Technology Tools
October 2000
U.S. Department of Commerce
Economics and Statistics Administration
National Telecommunications and Information Administration

THE SECRETARY OF COMMERCE
Washington, DC 20230
The digital economy is moving our Nation toward greater prosperity. Our goal at the Commerce Department is to ensure that all Americans - regardless of age, income, race, ethnicity, disability, gender or geography - gain access to the technological tools and skills needed in the new economy.
Falling Through the Net: Toward Digital Inclusion is a key part of the Department's ongoing efforts to promote full participation in the digital economy. It is important for our Nation to measure and analyze how the digital economy is affecting its citizens.
I am pleased that the data in this report show that, overall, our Nation is moving toward full digital inclusion. The number of Americans who are utilizing electronic tools in every aspect of their lives is rapidly increasing. However, a digital divide still remains. The report shows that not everyone is moving at the same speed, and identifies those groups that are progressing more slowly. The report also is rich with insights into how Americans are gaining access to key technologies, and how they are using such tools. With this information, we can better target and enact policies and programs to close the disparities in access to computers and the Internet that still are being experienced by some in our Nation.
I applaud the many public and private sector efforts that are helping Americans achieve greater access to the tools of the digital economy. We are rapidly becoming a digital Nation. We know that to not have access to such tools means to miss out on tremendous economic and educational opportunities. This report shows us that much work is left to be done.
Norman Y. Mineta
FALLING THROUGH THE NET:
TOWARD DIGITAL INCLUSION
|
National Telecommunications
Gregory L. Rohde, Assistant Secretary for
Communications and Information
|
Economics and Statistics Administration and Information Administration
Robert J. Shapiro, Under Secretary for Economic Affairs
|
||
|
JOINT PROJECT TEAM
|
|||
| for NTIA
Kelly K. Levy, Associate Administrator, Office of Policy Analysis and Development James McConnaughey, Senior Economist Wendy Lader, Senior Policy Advisor Art Brodsky, Director of Communications Sandra Laousis, Telecommunications Policy Analyst |
for ESA
Lee Price, Deputy Under Secretary for Economic Affairs Patricia Buckley, Senior Policy Advisor Sabrina Montes, Economist George McKittrick, Economist Gwendolyn Flowers, Chief Economist Jeffrey Mayer, Director of Policy Development |
||
|
JOINT PROJECT CONTRIBUTORS
|
|||
| for NTIA
Kathy Smith, Chief Counsel Milton Brown, Deputy Chief Counsel Steve Saleh, Program Officer Wayne Ritchie, Management and Program Analyst Lan Chu, Law Clerk |
for ESA
Jane Molloy, Director, Office of Policy Analysis Laurence Campbell, Senior Regulatory Policy Economist Sandra Cooke, Economist |
||
|
|
|||
| Demographic Surveys Division
Ronald R. Tucker, Adelle Berlinger Judith Eargle, Greg Weyland L. Dinah Flores, John M. McNeil Tim J. Marshall, Aileen Bennett |
Technologies Management Office
Andrew Stevenson |
Population Division
Eric Newburger |
|
| INTRODUCTION | xiii |
| EXECUTIVE SUMMARY | xv |
| PART I: HOUSEHOLD ACCESS TO COMPUTERS AND THE INTERNET | 1 |
|
2 |
|
2 |
|
4 |
|
8 |
|
10 |
|
12 |
|
17 |
|
20 |
|
23 |
|
25 |
|
25 |
|
27 |
| PART II: USE OF THE INTERNET BY INDIVIDUALS | 33 |
|
36 |
|
36 |
|
37 |
|
39 |
|
40 |
|
41 |
|
45 |
|
46 |
|
47 |
|
48 |
|
49 |
| PART III: INTERNET ACCESS AND COMPUTER USE AMONG PEOPLE WITH DISABILITIES | 61 |
|
62 |
|
67 |
|
69 |
|
70 |
|
71 |
|
72 |
|
73 |
|
75 |
|
78 |
|
81 |
|
83 |
| CONCLUSION - A LOOK AHEAD | 89 |
| METHODOLOGY | 91 |
|
91 |
|
92 |
|
|
|
| Box II-1 The Relationship Between the Household- and Person-based Measures | 35 |
| Box III-1 The Survey on Income and Program Participation | 62 |
|
Box III-2 Building a Disability Category
|
64 |
|
|
|
| Figure I-1 Percent of U.S. Households with a Computer and Internet Access, Selected Years | 1 |
| Figure I-2 An Illustrative S Curve | 3 |
| Figure I-3 Percent of U.S. Households with Internet Access, by U.S., Rural, Urban, and Central Cities, 1998 and 2000 | 4 |
| Figure I-4 Percent of Rural Households with Internet Access, by Income, 1998 and 2000 | 5 |
| Figure I-5 Percent of U.S. Households with a Computer, by U.S., Rural, Urban, and Cities, 1994, 1997, 1998, 2000 | 7 |
| Figure I-6 Percent of U.S. Households with Internet Access, by Income, 1998 and 2000 | 8 |
| Figure I-7 Percent of U.S. Households with a Computer, by Income, 1998 and 2000 | 10 |
| Figure I-8 Percent of U.S. Households with Internet Access, by Education, 1998 and 2000 | 11 |
| Figure I-9 Percent of U.S. Households with Internet Access by Income and Education, 1998 and 2000 | 12 |
| Figure I-10 Percent of U.S. Households with Internet Access, by Race/Hispanic Origin, 1998 and 2000 | 13 |
| Figure I-11 Rate of Growth of Internet Penetration, by Race/Hispanic Origin, 1998 and 2000 | 14 |
| Figure I-12 Income and Education Differences Account for Half of the Gap between Blacks and Hispanics and the National Average, 2000 | 15 |
| Figure I-13 Percent of U.S. Households with a Computer, by Race/Hispanic Origin, 1998 and 2000 | 16 |
| Figure I-14 Percent of U.S. Households with a Computer, by Family Type, 1998 and 2000 | 18 |
| Figure I-15 U.S. Households with High Speed Internet Access, 2000 | 24 |
| Figure I-16 Percent of U.S. Households with Internet Access, by Access Speed, By U.S., Rural, Urban, and Central Cities, 2000 | 24 |
| Figure I-17 Reasons for U.S. Households with a Computer/Web TV Never Accessing the Internet, Percent Distribution, 2000 | 26 |
| Figure I-18 Reasons for U.S. Households Discontinuing Internet Use, Percent Distribution, 2000 | 28 |
| Figure II-1 Different Perspectives on Internet Access and Use, 1998 and 2000 | 35 |
| Figure II-2 Broad Increases in Internet Use Since 1998 | 36 |
| Figure II-3 Internet Use by Income, 1998 and 2000 | 37 |
| Figure II-4 Internet Use by Race/Hispanic Origin, 1998 and 2000 | 38 |
| Figure II-5 Household Access Rates by Race/Hispanic Origin Do Not Closely Track Internet Use by Persons, 2000 | 38 |
| Figure II-6 Internet Use by Gender and Age, 1998 and 2000 | 39 |
| Figure II-7 Internet Use by Gender and Race/Hispanic Origin, 1998 and 2000 | 40 |
| Figure II-8 Internet Use Rates by Educational Attainment, 1998 and 2000 | 41 |
| Figure II-9 Internet Use by Age Group, 1998 and 2000 | 41 |
| Figure II-10 Internet Use by Income, Age 18-24, 1998 and 2000 | 43 |
| Figure II-11 Internet Use Age 25-49 and Labor Force Status, 1998 and 2000 | 44 |
| Figure II-12 Internet Use Age 50+ and Labor Force Status, 1998 and 2000 | 45 |
| Figure II-13 Internet Access by Location, 2000 | 46 |
| Figure II-14 Internet Use by Location and Race/Hispanic Origin, 2000 | 46 |
| Figure II-15 Online Activities, 1998 and 2000 | 48 |
| Figure II-16 The Percent of Internet Users Searching for Jobs on the Internet Declines as Income Increases, 2000 | 50 |
| Figure III-1 Internet Access by Disability Status, 1999 | 65 |
| Figure III-2 Personal Computer Use Experience by Disability Status, 1999 | 66 |
| Figure III-3 Regular Users of PCs by Location and Disability Status, 1999 | 66 |
| Figure III-4 Income Distribution for Persons with a Disability, 1999 | 68 |
| Figure III-5 Income Distribution for Persons without a Disability, 1999 | 68 |
| Figure III-6 Age Distribution for Persons with a Disability, 1999 | 68 |
| Figure III-7 Age Distribution for Persons without a Disability, 1999 | 68 |
| Figure III-8 Employment Status Distribution for Persons with a Disability, 1999 | 68 |
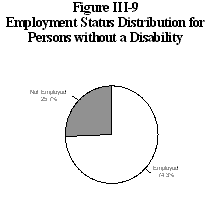
| Figure III-9 Employment Status Distribution for Persons without a Disability, 1999 | 68 |
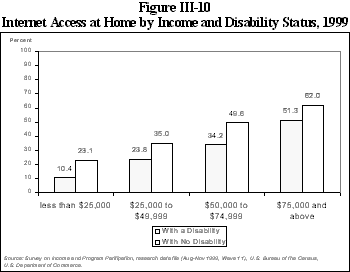
| Figure III-10 Internet Access at Home, by Income and Disability Status, 1999 | 69 |
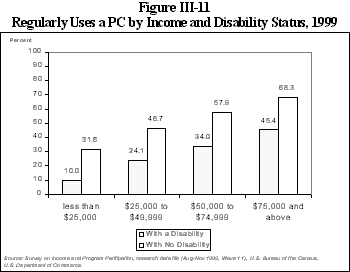
| Figure III-11 Regular Users of PCs, by Income and Disability Status, 1999 | 69 |
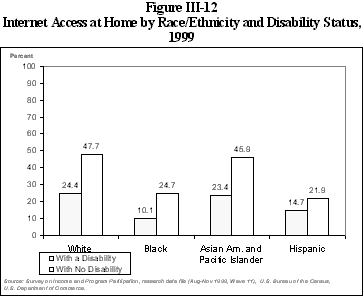
| Figure III-12 Internet Access at Home, by Race/Hispanic Origin and Disability Status, 1999 | 70 |
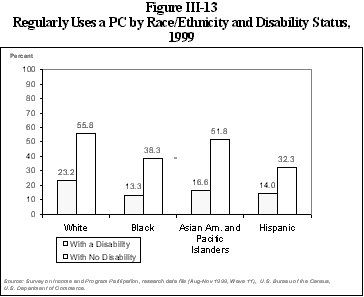
| Figure III-13 Regularly Uses a PC, by Race/Hispanic Origin and Disability Status, 1999 | 70 |
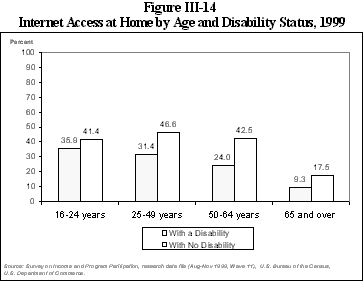
| Figure III-14 Internet Access at Home, by Age and Disability Status, 1999 | 71 |
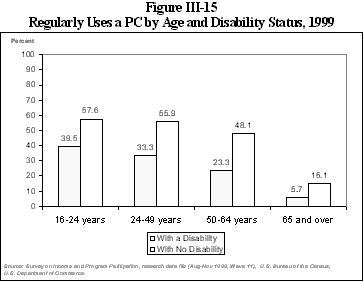
| Figure III-15 Regular Users of PCs by Age and Disability Status, 1999 | 71 |
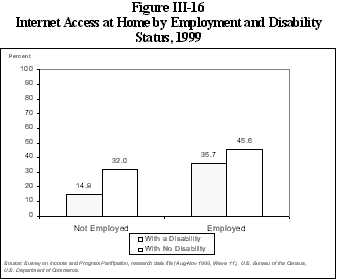
| Figure III-16 Internet Access at Home, by Employment and Disability Status, 1999 | 72 |
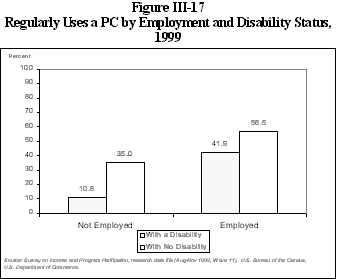
| Figure III-17 Regular Users of PCs, by Employment and Disability Status, 1999 | 72 |
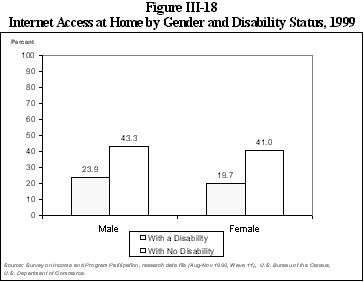
| Figure III-18 Internet Access at Home by Gender and Disability Status, 1999 | 73 |
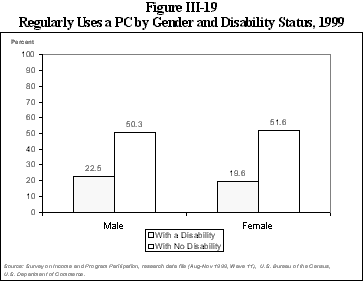
| Figure III-19 Regular Users of PCs by Gender and Disability Status, 1999 | 73 |
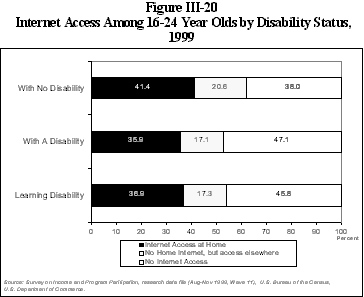
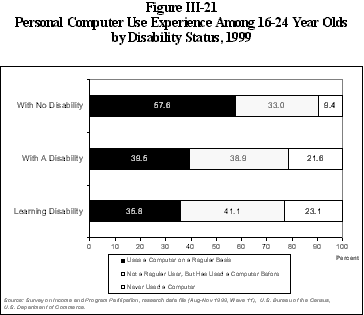
| Figure III-20 Internet Access Among 16-24 Year Olds, by Disability Status, 1999 | 76 |
| Figure III-21 Personal Computer Use Experience Among 16-24 Year Olds, by Disability Status, 1999 | 76 |
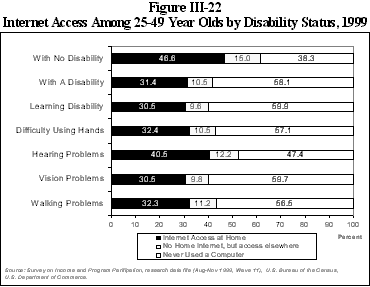
| Figure III-22 Internet Access Among 25-49 Year Olds, by Disability Status, 1999 | 78 |
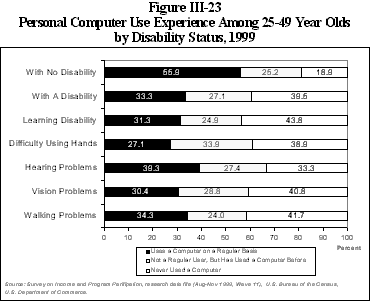
| Figure III-23 Personal Computer Use Experience Among 25-49 Year Olds, by Disability Status, 1999 | 78 |
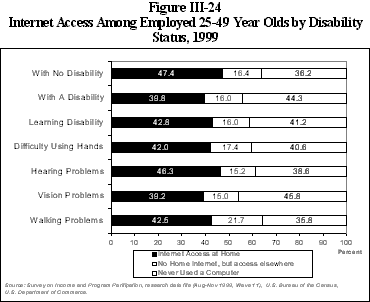
| Figure III-24 Internet Access Among Employed 25-49 Year Olds, by Disability Status, 1999 | 79 |
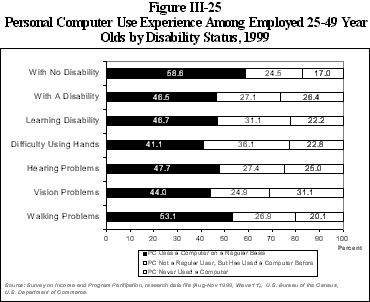
| Figure III-25 Personal Computer Use Experience Among Employed 25-49 Year Olds, by Disability Status, 1999 | 79 |
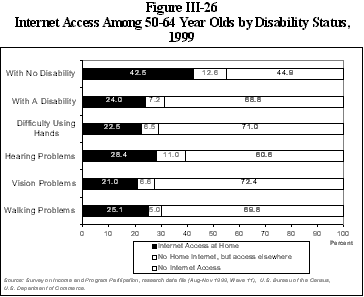
| Figure III-26 Internet Access Among 50-64 Year Olds, by Disability Status, 1999 | 81 |
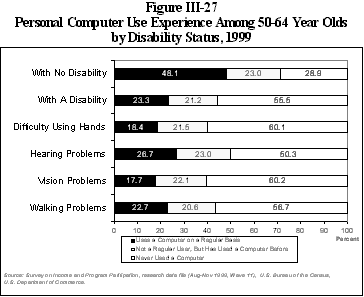
| Figure III-27 Personal Computer Use Experience Among 50-64 Year Olds, by Disability Status, 1999 | 81 |
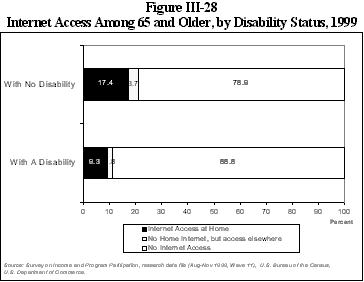
| Figure III-28 Internet Access Among 65 and Older, by Disability Status, 1999 | 83 |
|
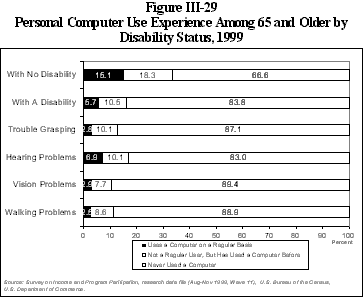
Figure III-29 Personal Computer Use Experience Among 65 and Older, by
Disability Status, 1999
|
83 |
|
|
|
| Table I-A Percent of Households with Computers, by State, 2000 | 21 |
| Table I-B Percent of Households with Internet Access, by State, 2000 | 22 |
| Table I-1 Percent of Households with a Computer, 1998 and 2000 | 30 |
| Table I-2 Percent of Households with Internet Access, 1998 and 2000 | 31 |
| Table II-1 Internet Use by Individuals Age 3 and Older, 1998 and 2000 | 51 |
| Table II-2 Internet Use by Individuals Age 3-8 Years, 1998 and 2000 | 52 |
| Table II-3 Internet Use by Individuals Age 9-17, 1998 and 2000 | 53 |
| Table II-4 Internet Use by Individuals Age 18-25, 1998 and 2000 | 54 |
| Table II-5 Internet Use by Individuals Age 25-49 In the Labor Force, 1998 and 2000 | 55 |
| Table II-6 Internet Use by Individuals Age 25-49 Not in the Labor Force, 1998 and 2000 | 56 |
| Table II-7 Internet Use by Individuals Age 50+ In the Labor Force, 1998 and 2000 | 57 |
| Table II-8 Internet Use by Individuals Age 50 + Not in the Labor Force, 1988 and 2000 | 58 |
| Table II-9 Reconciliation of Household Access and Individual Internet Use Rates for 2000 | 59 |
| Table III-1 Disability Status of Persons 16 and Above, 1999 | 63 |
| Table III-2 Population Distribution, by Age and Disability, 1999 | 74 |
| Table III-3 Internet Access and Computer Use by 16-24 Year Olds, 1999 | 77 |
| Table III-4 Internet Access and Computer Use by 25-49 Year Olds, 1999 | 80 |
| Table III-5 Internet Access and Computer Use by 50-64 Year Olds, 1999 | 82 |
| Table III-6 Internet Access and Computer Use by 65 Year Olds and Older, 1999 | 84 |
| Table III-7 Individuals 16 and Over, 1999 | 85 |
| Table III-8 Internet Access and Computer Use, 1999 | 86 |
|
Table III-9 Disability, by Age, 1999
|
87 |
|
|
|
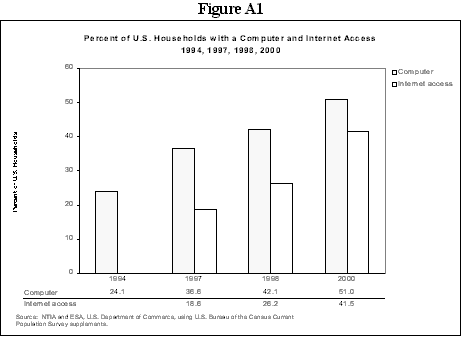
| Figure A1 Percent of U.S. Households with a Computer and Internet Access 1994, 1997, 1998, 2000 | 94 |
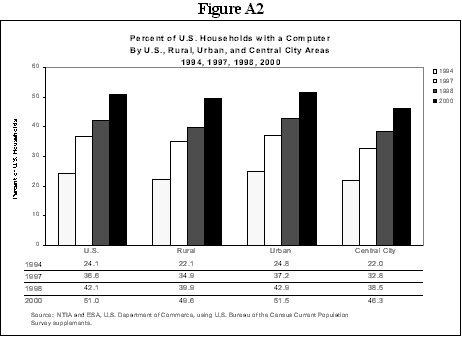
| Figure A2 Percent of U.S. Households with a Computer By U.S., Rural, Urban, and Central Cities, 1994, 1997, 1998, 2000 | 94 |
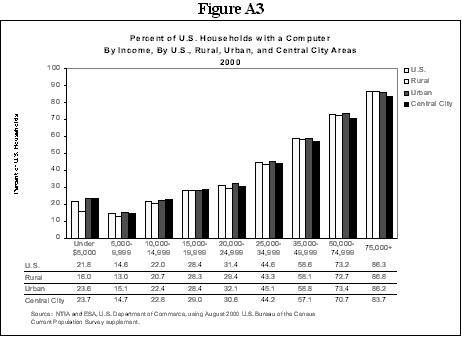
| Figure A3 Percent of U.S. Households with a Computer By Income, By U.S., Rural, Urban, and Central Cities, 2000 | 95 |
| Figure A4 Percent of U.S. Households with a Computer By Race/Hispanic Origin, By U.S., Rural, Urban, and Central City Areas, 2000 | 95 |
| Figure A5 Percent of U.S. Households with a Computer By Income, By Race/ Hispanic Origin, 2000 | 96 |
| Figure A6 Percent of U.S. Households with a Computer By Education, By U.S., Rural, Urban, and Central Cities, 2000 | 96 |
|
Figure A7 Percent of U.S. Households with a Computer By Household Type, By U.S., Rural, Urban, and Central Cities, 2000 |
97 |
|
Figure A8 Percent of U.S. Households with Internet Access By U.S. Rural, Urban and Central Cities,1998 and 2000 |
97 |
|
Figure A9 Percent of U.S. Households with Internet Access By Income, By U.S., Rural, Urban, and Central Cities, 2000 |
98 |
|
Figure A10 Percent of U.S. Households with Internet Access By Race/Hispanic Origin, By U.S., Rural, Urban, and Central Cities, 2000 |
98 |
| Figure A11 Percent of U.S. Households with Internet Access By Income, By Race/Hispanic Origin, 2000 | 99 |
|
Figure A12 Percent of U.S. Households with Internet Access By Education, By U.S., Rural, Urban, and Central Cities, 2000 |
99 |
|
Figure A13 Percent of U.S. Households with Internet Access By Household Type, By U.S., Rural, Urban, and Central Cities, 2000 |
100 |
|
Figure A14 Percent of U.S. Households with Internet Access By Age, By U.S., Rural, Urban, and Central Cities, 2000 |
100 |
|
Figure A15 Percent of U.S. Households with High-Speed Internet Access, 2000 |
101 |
|
Figure A16 Percent of U.S. Households with High-Speed Internet Access By Technology and Age, 2000 |
101 |
|
Figure A17 Percent of U.S. Households with Internet Access, By speed, By Region, 2000 |
102 |
|
Figure A18 Percent of U.S. Households with Internet Access, By speed, By Income, 2000 |
102 |
|
Figure A19 Percent of U.S. Households with Internet Access, By Access Speed, By Education, 2000 |
103 |
|
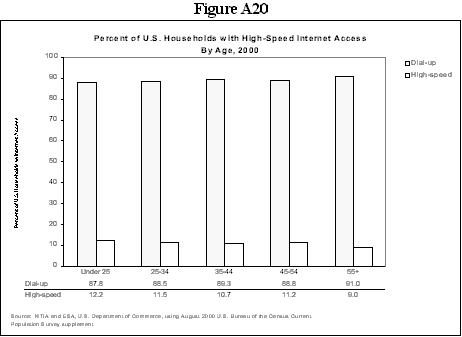
Figure A20 Percent of U.S. Households with Internet Access, By Access Speed, By Age, 2000 |
103 |
|
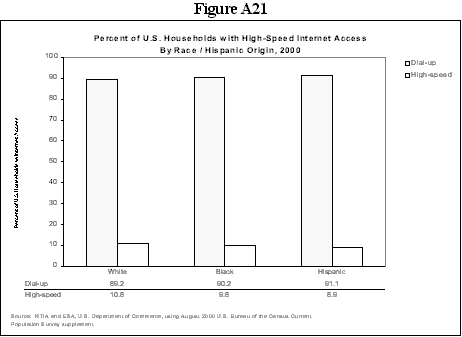
Figure A21 Percent of U.S. Households with Internet Access, By Access Speed, By Race/Hispanic Origin, 2000 |
104 |
|
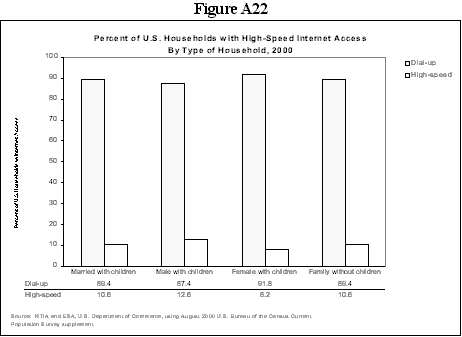
Figure A22 Percent of U.S. Households with Internet Access, By Access Speed, By Type of Household, 2000 |
104 |
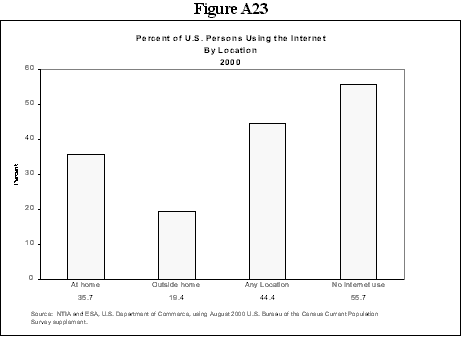
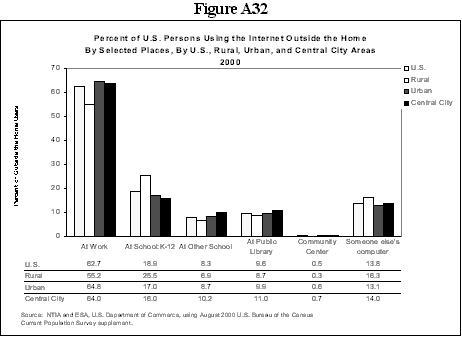
| Figure A23 Percent of U.S. Persons Using the Internet By Location, 2000 | 105 |
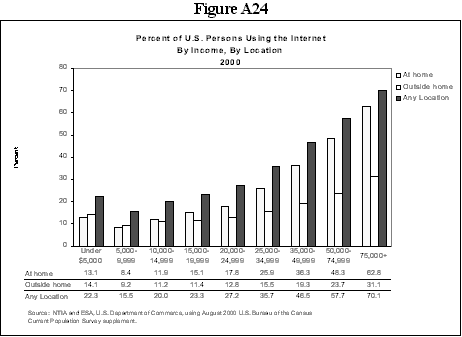
| Figure A24 Percent of U.S. Persons Using the Internet By Income, By Location, 2000 | 105 |
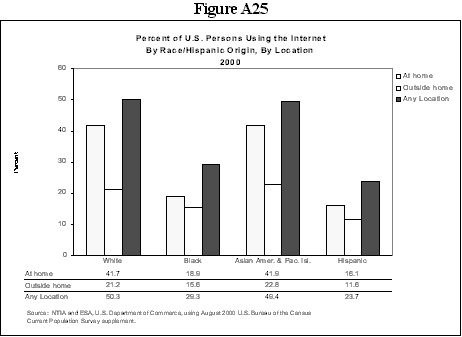
| Figure A25 Percent of U.S. Persons Using the Internet By Race/Hispanic Origin, By Location, 2000 | 106 |
|
Figure A26 Percent of U.S. Persons Using the Internet At Home By Race/Hispanic Origin, By U.S., Rural, Urban, and Central Cities, 2000 |
106 |
|
Figure A27 Percent of U.S. Persons Using the Internet Outside the Home By Race/Hispanic Origin, By U.S., Rural, Urban, and Central Cities, 2000 |
107 |
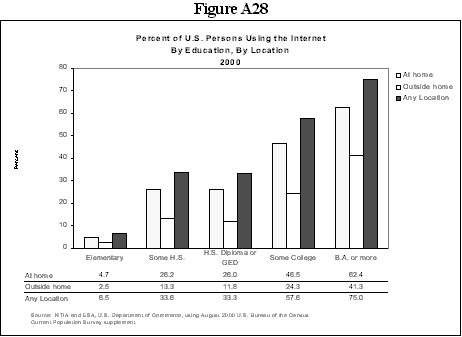
| Figure A28 Percent of U.S. Persons Using the Internet By Education, By Location, 2000 | 107 |
|
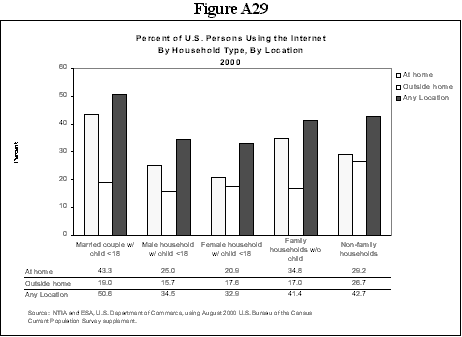
Figure A29 Percent of U.S. Persons Using the Internet, By Household Type, By Location, 2000 |
108 |
|
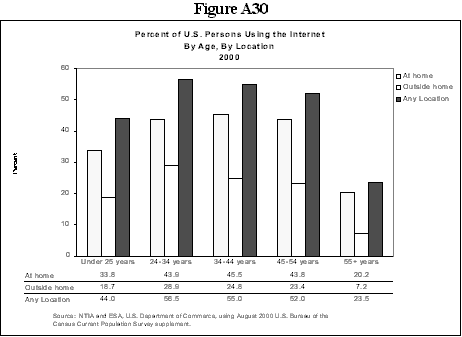
Figure A30 Percent of U.S. Persons Using the Internet, By Age, By Location, 2000 |
108 |
|
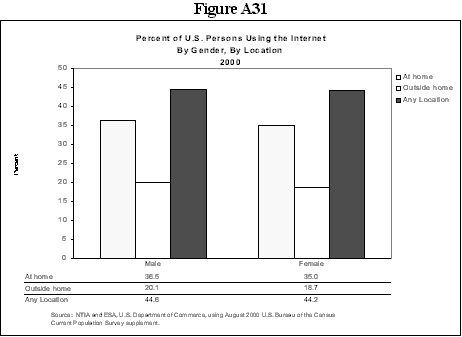
Figure A31 Percent of U.S. Persons Using the Internet, By Gender, By Location, 2000 |
109 |
|
Figure A32 Percent of U.S. Persons Using the Internet Outside the Home By Selected Places, By U.S., Rural, Urban, and Central Cities, 2000 |
109 |
|
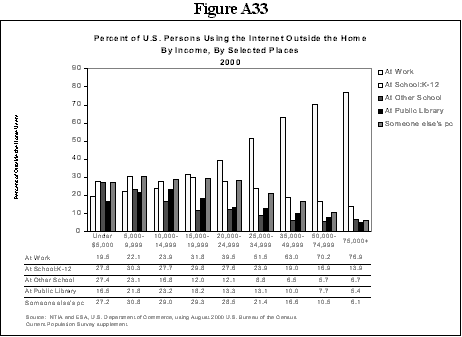
Figure A33 Percent of U.S. Persons Using the Internet Outside the Home By Income, By Selected Places, 2000 |
110 |
|
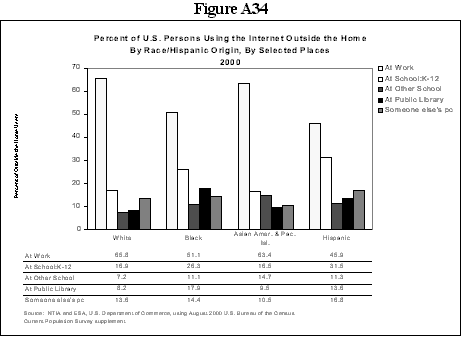
Figure A34 Percent of U.S. Persons Using the Internet Outside the Home By Race/Hispanic Origin, By Selected Places, 2000 |
110 |
|
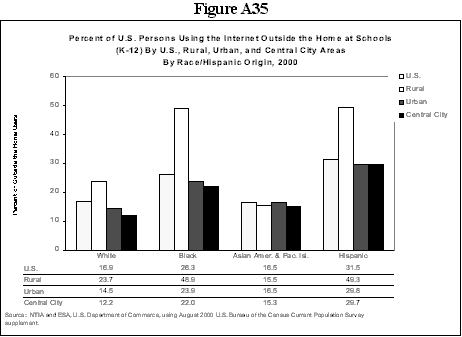
Figure A35 Percent of U.S. Persons Using the Internet Outside the Home at Schools (K-12) By U.S., Rural, Urban, and Central Cities By Race/Hispanic Origin, 2000 |
111 |
|
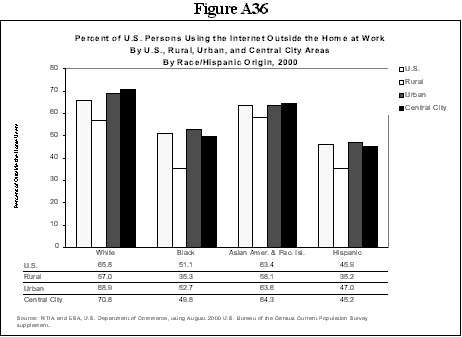
Figure A36 Percent of U.S. Persons Using the Internet Outside the Home at Work By U.S., Rural, Urban, and Central Cities, By Race/Hispanic Origin, 2000 |
111 |
|
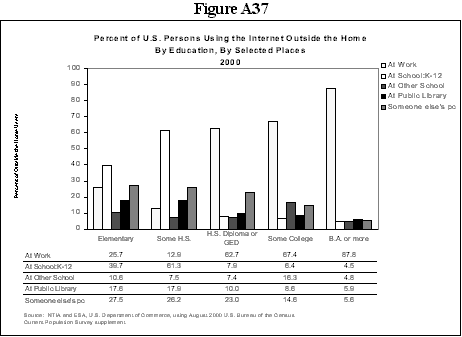
Figure A37 Percent of U.S. Persons Using the Internet Outside the Home By Education, By Selected Places, 2000 |
112 |
|
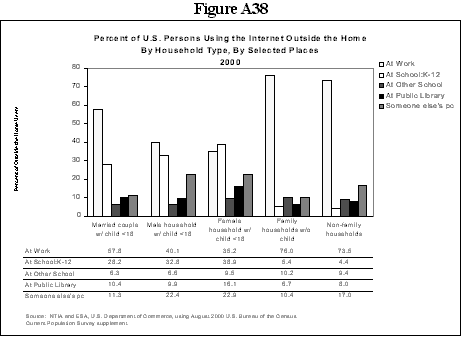
Figure A38 Percent of U.S. Persons Using the Internet Outside the Home By Household Type, By Selected Places, 2000 |
112 |
|
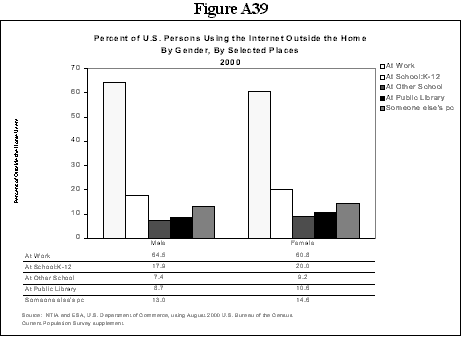
Figure A39 Percent of U.S. Persons Using the Internet Outside the Home By Gender, By Selected Places, 2000 |
113 |
|
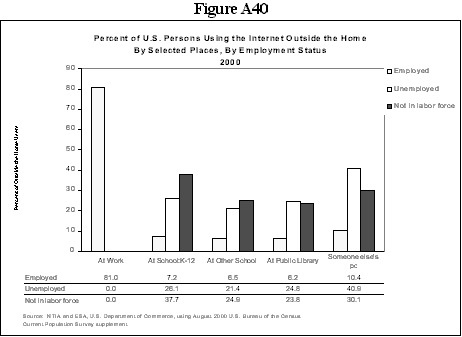
Figure A40 Percent of U.S. Persons Using the Internet Outside the Home By Selected Places, By Employment Status, 2000 |
113 |
|
Figure A41 Reasons for Households with a Computer/WebTV Not Using the Internet at Home, By Income, 2000 |
114 |
| Figure A42 Reasons for Households with a Computer/WebTV Not Using the Internet at Home, By Race/Hispanic Origin, 2000 | 114 |
|
Figure A43 Reasons for Households with a Computer/WebTV Not Using the Internet at Home, By Education, 2000 |
115 |
|
Figure A44 Reasons for Households with a Computer/WebTV Not Using the Internet at Home, By Household Type, 2000 |
115 |
|
Figure A45 Reasons for Households with a Computer/WebTV Not Using the Internet at Home, By Age, 2000 |
116 |
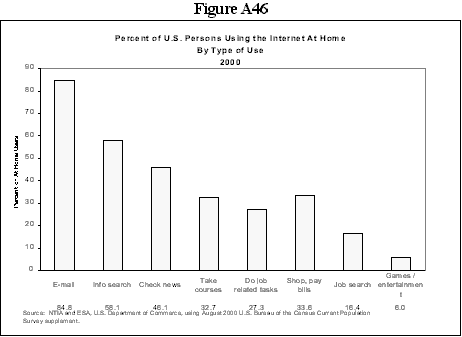
| Figure A46 Percent of U.S. Persons Using the Internet At Home By Type of Use, 2000 | 116 |
|
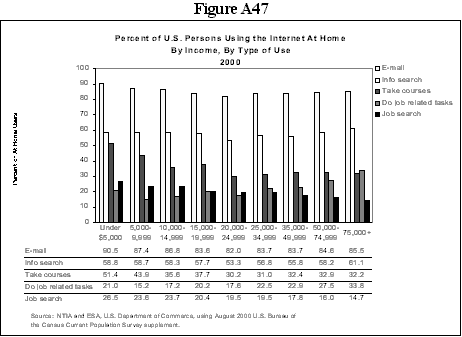
Figure A47 Percent of U.S. Persons Using the Internet At Home By Income, By Type of Use, 2000 |
117 |
|
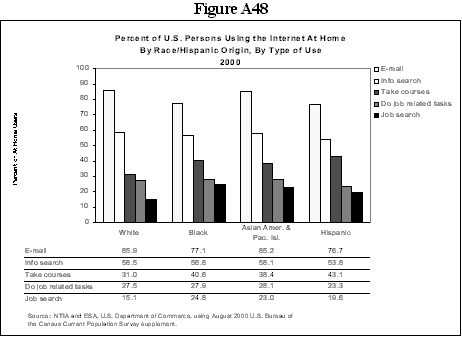
Figure A48 Percent of U.S. Persons Using the Internet At Home By Race/Hispanic Origin, By Type of Use, 2000 |
117 |
|
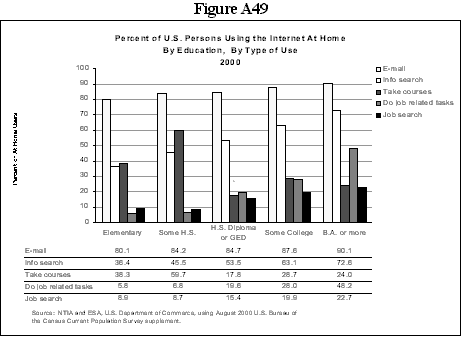
Figure A49 Percent of U.S. Persons Using the Internet At Home By Education, By Type of Use, 2000 |
118 |
|
Figure A50 Percent of U.S. Persons Using the Internet At Home By Type of Use, By Employment Status, 2000
|
118 |
|
Appendix Table 1 Reasons for Discontinuing Home Internet Use, by Selected Characteristics of Reference Person, Total, Urban, Rural, Central City, 2000 |
119 |
Robert J. Shapiro
Under Secretary for Economic Affairs
Administrator, Economics and Statistics Administration
Gregory L. Rohde
Assistant Secretary for Communications and Information
Administrator, National Telecommunications and Information Administration
This is the fourth report in the Commerce Department series of studies, Falling Through the Net. The previous three were focused on the theme of the "Digital Divide," the concept that the society should not be separated into information haves and information have-nots.
With this report, we move into a new phase of our information-gathering and policy-making by recognizing the phenomenal growth that has taken place in the availability of computing and information technology tools, tempered by the realization that there is still much more to be done to make certain that everyone is included in the digital economy. Thus, the theme for this year, Toward Digital Inclusion, recognizes each element of the equation---the progress made and the progress yet to be made.
Measuring the growth and use of the Internet is, like the Internet itself, a complex endeavor. This report reflects our attempt to capture three of the key benchmarks. Part I looks at Internet and computer access of households. We do this because the household is the traditional standard by which access is defined, in the United States and around the world. The examination of household access includes such factors as geography, income, race, and household type.
In looking at the results and trying to determine the progress from year to year, it is important to understand that there is more than one way to interpret the results. When looking at computer and Internet access, it is clear that certain groups have far higher levels of Internet access and computer ownership. These groups have generally exhibited greater percentage point changes in their penetration rates from one survey to the next. On the other hand, they exhibit slower expansion rates from one survey to the next. At the same time, groups with lower penetration rates are exhibiting smaller percentage point changes but higher expansion rates because they are starting from a much lower base and have more opportunity for rapid and greater expansion.
Part I also includes a new facet to the survey. For the first time, we survey household access to high-speed Internet services, primarily through cable TV and Digital Subscriber Line services. There are large differences in high-speed access based on income and other variables, and these initial data will enable us to track the increases and diffusion of high-speed access as broadband infrastructure is widely adopted.
Part II provides a different way of looking at the penetration of Internet access and computers. Instead of looking at households, this section of the report examines computer and online access by individuals. Many households, for example, include people who do not use the Internet, and the rate or degree at which this occurs differs among groups. By focusing on individuals, we are also able to capture important differences in Internet use based on people's age, gender, and labor force status. We can also look at how people use the Internet, for example, for e-mail or to look for a job, as well as where they use it, whether at home or at a library, for example.
Part III, for the first time, examines the use of computers and the Internet among people with disabilities that adversely affect their ability to walk, to see, to hear, to use their hands and fingers, or to learn. In general, Internet access is half as common among people with disabilities as among other people, and computer access is even more skewed. To some degree this may reflect the fact that on average, disabled people are older and less likely to be employed, and also have lower incomes than people without disabilities. All of these variables are associated with lower computer and Internet use.
By preparing and issuing this report, we hope to establish an objective baseline so the American people can understand the critical issue of access to the information technologies that are transforming the economy and our lives. In this way, this report can provide a basis for the continuing public debate about how best to ensure that every American can participate in the digital economy.
The Internet is becoming an increasingly vital tool in our information society. More Americans are going online to conduct such day-to-day activities as education, business transactions, personal correspondence, research and information-gathering, and job searches. Each year, being digitally connected becomes ever more critical to economic and educational advancement and community participation. Now that a large number of Americans regularly use the Internet to conduct daily activities, people who lack access to these tools are at a growing disadvantage. Therefore, raising the level of digital inclusion by increasing the number of Americans using the technology tools of the digital age is a vitally important national goal.
This report, Falling Through the Net: Toward Digital Inclusion, is the fourth in the Falling Through the Net series. In this report, we measure the extent of digital inclusion by looking at households and individuals that have a computer and an Internet connection. We measure the digital divide, as we have before, by looking at the differences in the shares of each group that is digitally connected. For the first time, we also provide data on high-speed access to the Internet, as well as access to the Internet and computers by people with disabilities.
The data show that the overall level of U.S. digital inclusion is rapidly increasing:
The rapid uptake of new technologies is occurring among most groups of Americans, regardless of income, education, race or ethnicity, location, age, or gender, suggesting that digital inclusion is a realizable goal. Groups that have traditionally been digital "have nots" are now making dramatic gains:
Nonetheless, a digital divide remains or has expanded slightly in some cases, even while Internet access and computer ownership are rising rapidly for almost all groups. For example, our most recent data show that divides still exist between those with different levels of income and education, different racial and ethnic groups, old and young, single and dual-parent families, and those with and without disabilities.
-- The divide between Internet access rates for Black households and the national average rate was 18 percentage points in August 2000 (a 23.5% penetration rate for Black households, compared to 41.5% for households nationally). That gap is 3 percentage points wider than the 15 percentage point gap that existed in December 1998.
-- The Internet divide between Hispanic households and the national average rate was 18 percentage points in August 2000 (a 23.6% penetration rate for Hispanic households, compared to 41.5% for households nationally). That gap is 4 percentage points wider than the 14 percentage point gap that existed in December 1998.
-- With respect to individuals, while about a third of the U.S. population uses the Internet at home, only 16.1% of Hispanics and 18.9% of Blacks use the Internet at home.
-- Differences in income and education do not fully account for this facet of the digital divide. Estimates of what Internet access rates for Black and Hispanic households would have been if they had incomes and education levels as high as the nation as a whole show that these two factors account for about one-half of the differences.
-- The August 2000 divide between Black households and the national average rate with regard to computer ownership was 18 percentage points (a 32.6% penetration rate for Black households, compared to 51.0% for households nationally). That gap is statistically no different from the gap that existed in December 1998.
-- Similarly, the 17 percentage point difference between the share of Hispanic households with a computer (33.7%) and the national average (51.%) did not register a statistically significant change from the December 1998 computer divide.
Americans are using the Internet in the following ways:
Internet access is no longer a luxury item, but a resource used by many. Overall, the findings in this report show that there has been tremendous progress in just 20 months, but much work remains to be done. Computer ownership and Internet access rates are rapidly rising nationwide and for almost all groups. Nonetheless, there are still sectors of Americans that are not digitally connected.
HOUSEHOLD ACCESS TO COMPUTERS AND THE INTERNET
Americans bought home computers and hooked them up to the Internet at a remarkable rate between December 1998 and August 2000. In just 20 months, the share of households with Internet access soared by 58%, from 26.2% to 41.5%, while the share of households with computers rose from 42.1% to 51.0%.(1) More than 80% of households with computers also have Internet access today, up from little more than 60% in 1998.
Virtually every group has participated in the sharp upward trend of Americans connecting their homes to the Internet. Large gains occurred at every income category, at all education levels, among all racial groups, in both rural and urban America, and in every family type. As documented since 1997, certain groups are much further ahead than others in establishing Internet connections from home. This year, however, we found that households in the middle income and education ranges are gaining ground in connecting to the Internet at a rate as fast or faster than those at the top ranges.
The rapid growth in computer and Internet use among those in the middle income and education ranges and among relatively disadvantaged populations suggests that, in some cases, the digital divide has begun to narrow or will do so soon, and that we are entering a period of fuller digital inclusion. In general, groups with very low adoption levels in 1998 experienced some of the highest expansion or growth rates over the last two years, even though they may not have experienced a high percentage-point change.(2) (See Tables I-1 and I-2 on pages 30 and 31.)
This section of the report examines the prevalence of households with home computers and Internet access by various demographic and geographic breakdowns, and also discusses reasons why some households with computers chose not to go online. We also look at the penetration of higher speed Internet access. Although still modest---11% of Internet users and 4% of all households---these broadband connectivity rates establish a benchmark for future comparisons.
OVERALL HOUSEHOLD FINDINGS: THE NATION MOVES TOWARD DIGITAL INCLUSION
Between December 1998 and August 2000, U.S. households' access to computers and the Internet grew dramatically. According to the latest survey, 43.6 million households (or 41.5% of all households) had Internet access.(3) The percentage of homes with household Internet access registered an impressive 58% gain from the 26.2% penetration rate in December 1998.
Computer ownership has also continued to soar. In August 2000 53.7 million households had computers. The percentage of homes with computers rose by 21%, from 42.1% to 51.0%, from December 1998 to August 2000. Taking a slightly longer view, since 1997, computer penetration has risen by almost 40%, while Internet access has soared by 123%.
The rapid uptake of the Internet is perhaps best revealed by examining the growing percentage of households with computers or other devices that connect to the Internet. In 1997, just over half of all households with computers had Internet access. By 2000, that figure had surged to four out of five households.
DIGITAL INCLUSION PROCEEDS UNEVENLY
The tremendous growth in household computer and Internet use has occurred across all demographic groups, including income and education levels, races, locations, and household types. Nevertheless, some Americans are still connecting at far lower rates than others, creating a digital divide (i.e., a difference in rates of access to computers and the Internet) among different demographic groups.
Certain groups (such as Whites, Asian Americans and Pacific Islanders, and those with higher income and education levels) have higher than average levels of computer ownership and Internet access. These groups have generally exhibited greater percentage point changes (that is, the change in penetration rate from one survey to the next). On the other hand, they exhibit slower expansion or growth rates (i.e., growth in the percentage rate). At the same time, groups with lower penetration rates (such as Blacks, Hispanics, and those with lower income and education levels) are exhibiting smaller percentage point changes but higher expansion rates because they are starting from a much lower base and have more opportunity for rapid, and greater, expansion. For example, a group that had a penetration rate of 10% in December 1998 and 20% in August 2000 would exhibit a 100% expansion rate but only a 10 percentage point change.
A case in point centers on households with both high income and high education levels. These households made substantial percentage point gains in Internet access over 20 months. They had already achieved relatively high levels of penetration by December 1998. Their expansion rates since that date, however, have been matched or surpassed by those with mid-range incomes and levels of education.
The pattern exhibited thus far by household access to both computers and the Internet accords with the "S-curve" pattern typically observed in the adoption of new technologies. Historically, when a new technology is first introduced, the number of users expands rapidly but from a low base. Over time, as a group reaches the middle range of the S-curve, the growth rate tends to slow while the point change continues to increase. Once the penetration nears its saturation point (at the higher end of the S-curve), both the percentage point change and the expansion rate begin to decrease.
The adoption rates along these curves depend on a number of factors, including the awareness of the new technology, the affordability of that technology, adaptations to the technology to widen its potential market, and the attraction for people to use the technology as its usage becomes widespread. The purchase of computers for the home has been spurred not only by falling prices and more user-friendly software, but also by public policy decisions not to regulate or otherwise impede the rapid expansion of the Internet. For Internet access itself, the continuation of public policies to promote competition (that lowers prices and improves quality) and to make new technologies more accessible will substantially influence the uptake rates of the current groups of information "have-nots," and will help move these groups to greater digital inclusion.
Below we examine variations in household Internet and computer access, looking at differences in geography, income, race/ethnicity, education, and household type.
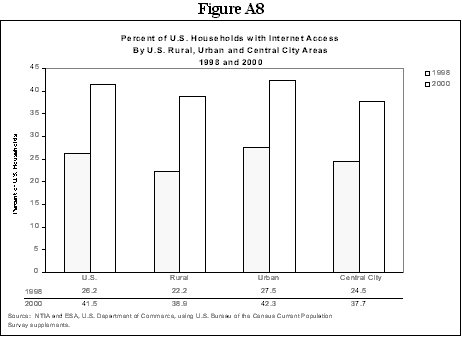
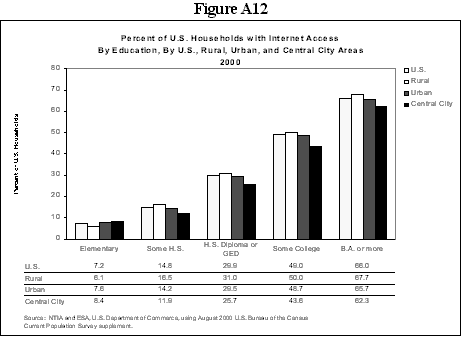
One of the most dramatic shifts that has occurred since December 1998 has been the increase in Internet access by rural households. Rural areas narrowed the divide when compared to the national average. In contrast, central cities had significant increases in access, but fell behind other parts of the country in terms of the gains in access. Urban areas, even though they include central cities, continue to have a greater percentage of households with Internet penetration than rural areas.(4) Data relating to Internet access by geography can be found in the Appendix, Figures A8-A10, A12-A14.
Rural Households Narrow the Gap
Rural households, which historically trailed those in central cities and urban areas, are showing significant gains in Internet access. The gap between households in rural areas and households nationwide that access the Internet has recently narrowed. There was a 4.0 percentage point difference in 1998, narrowing to a 2.6 point difference in 2000.
In rural areas this year, 38.9% of households had Internet access, an increase of 75% from 1998's access rate of 22.2%. In October 1997, just 14.8% of rural households had online access.
Rural Black households, which have historically had the lowest rates of Internet access, made significant gains. In December 1998, 7.1% of those households had Internet access. By 2000, the figure jumped to 19.9%.
The growth in rural Internet household access has come at all income levels, with the lowest levels showing some of the highest growth rates. As a result, the Internet access rates for rural households now approximate those of households across the country.
In the lowest income category, households with income below $15,000, Internet access for rural households rose from 4.6% to 11.3%. At most of the other income levels, rural households now come close to the nationwide figures, having doubled their access rates through the middle income levels. Growth rates have been slower at the highest income levels, but the access rates are only slightly below the national average.
Slower Growth in Central Cities
In contrast to the strong growth in rural areas, households in central cities have experienced much lower rates of increase for their Internet penetration. In August 2000, 37.7% of central city households had Internet access, contrasted with the national figure of 41.5%-a gap of 3.8 percentage points. In December 1998, central city households had a 24.5% access rate, 1.7 percentage points lower than the national rate. In terms of the national figures, the gap appears to be growing, rather than narrowing, and central cities have slipped below the rural areas in terms of household access.
Although households in central cities experienced double-digit growth in household Internet access, their access rate was below that of the national average. The increase for central city households from December 1998 to August 2000 was 13.2 percentage points (an expansion of 54%). This compares to an increase over the 14 months between the 1997 and 1998 surveys of 7.2 points (a growth rate of 42%).
Every income category for central city households showed double-digit percentage growth between 1998 and 2000. At the lowest income level, below $15,000, household Internet access nearly doubled, from 7.7% in 1998 to 13.5% in 2000 (an increase of 75%).
Black households in central cities registered a 20.1% access rate, about double the 1998 rate of 10.2%, but slightly below the national average for Blacks of 23.5%. Hispanic households in central cities had a 21.5% access rate, a little more than double the 1998 figure of 10.2%, but slightly below the national average for Hispanic households of 23.6%.(5) White central city households had a 47.1% Internet access rate, up from 32.3% in December 1998.
Urban Areas Continue Above-Average Internet Access
Urban areas continued to have the highest household Internet penetration rates. The rate of growth in household Internet access in urban areas between 1998-2000 was about the same as it was for central cities, about 57%. However, the level of Internet access in urban areas started from a high level, and continued to exceed the national average.
In urban areas, 42.3% of households had Internet access, contrasted with 41.5% of households nationally in 2000. Urban households have seen a steady increase over the last three years. In 1997, the Internet penetration rate for urban households was 19.9%. It grew to 27.5% in 1998. The lowest income levels saw a 72% increase between 1998 and 2000, which translated to a 5.5 percentage point increase to the current level of 13.2% access for households with incomes under $15,000. The $75,000+ category had a household access rate of 78.0%, the highest single category rate for the geographic regional breakdown.
Each racial and ethnic group had higher household Internet penetration rates in urban areas than in rural areas. Urban Black households registered a 24.0% access rate, up from 11.7% in December 1998, and contrasted with the rural figure of 19.9% for Black households. Hispanic households had a 23.9% rate, up from 12.9% in December 1998, and above the 19.9% rural rate for Hispanic households. The White household rate in urban areas was 48.3%, up from 32.4% in December 1998, and above the national average of 46.1%.
Snapshot from Geographical Regions
The West continues to be the most on-line region of the country, with household Internet access of 46.6%, followed by the Northeast (43.0%), Midwest (40.9%), and South (37.9%). Rural areas in the Northeast registered the highest access rate (49.9%), followed by urban areas in the West (47.2%). Northeast central city regions had the lowest household access rate (33.1%), followed by rural regions in the South (33.8%).
Computer Ownership by Geography
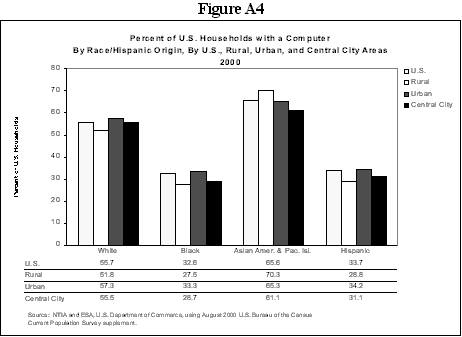
Nationally, just over half (51%) of households own computers, up from 42.1% in December 1998. Urban areas had the highest rate of ownership (51.5%), increasing 8.6 points in the last 20 months. Rural areas, tracking the growth in Internet access, increased 9.7 percentage points, to reach a household ownership level of 49.6%. Central cities had a 46.3% ownership rate, up 7.8 points since December 1998. All data relating to computer ownership by geography can be found in the Appendix, Figures A2-A4, A6-A7.
Households in all regions at all income levels also showed improvement in computer ownership. In both central cities and in urban areas, 20% of households with less than $15,000 in income now own computers, contrasted with 17% of rural households in the same income bracket. Nationally, 19.2% of households with less than $15,000 owned a computer in August 2000, up from 14.5% in December 1998.
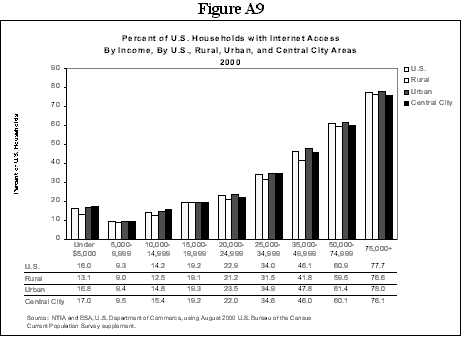
Although computers and Internet access are coming down in price, they are still sufficiently expensive that household income remains an important factor in home Internet access. Nevertheless, households across all income levels and throughout the country have made significant gains in Internet access since December 1998. Some of the biggest gains have come at every income level in rural areas. In addition, gains have been made at all income levels by different racial and ethnic groups. Data relating to Internet access by income can be found in the Appendix, Figures A9 and A11.
Internet Penetration Rises Across Income Levels
Household Internet access continues to correlate closely with income. Across the United States, however, households in the lower income bands registered increases in Internet access much faster than the national 58% gain. Households with less than $15,000 in income had a 12.7% Internet penetration rate, 79% higher than in December 1998(6) .Between 1997 and 1998, the income band improved 82%, from 3.9% penetration to 7.1%. At the $15,000-$24,999 income levels, 21.3% of households had Internet access. The rate of increase between 1998 and 2000 was 93%, as the penetration rate increased steadily from 8.1% in 1997, to 11.0% in 1998, to 21.3% in 2000. In August 2000, the penetration rate for households with incomes between $25,000 and $34,999 stood at 34.0%, an increase of 78% over the 19.1% penetration rate in 1998.
All three income ranges beyond $35,000 had the same 17 point gain from 1998 to 2000. Households with income between $35,000 and $49,999 achieved a 46.1% Internet penetration rate in 2000, up from 29.0% in 1998. Households with incomes between $50,000 and $74,999 went from 43.9% to 60.9%, while those at $75,000 and above climbed from 60.3% to 77.7%. With the same point gain but starting from much lower initial levels, the $35,000-$49,999 and the $50,000-$74,999 income groups had larger expansion rates than the highest income group.
Geographic Areas Show Different Rates of Increase
Different areas of the country showed different rates of growth in household Internet penetration at incomes below $75,000. At the highest income level ($75,000 and higher) household penetration was relatively equal in all geographic areas at 77%.
For households earning less than $15,000 annually, rural households had the lowest penetration rate at 11.3%. However, that rate is more than double what it was for the same group of households in 1998 (at 4.5%). In other locations, however, the household penetration rate for the lowest income group is higher, even if the rate of growth is lower. In urban areas, for example, 13.2% of lowest-income households had Internet access, an increase of 5.5 percentage points (72% higher than 1998 levels). Central city households with incomes below $15,000 achieved a 13.5% penetration rate in 2000, a 75% increase from 1998.
Rural areas at all income levels showed the highest percentage increases in penetration rates. In addition to the 146.5% for the lowest income group, households with incomes between $15,000 and $24,999 achieved increases of almost 120%. However, in August 2000, 17.0% of rural households at the lowest income level owned a computer, contrasted with 19.9% of households with less than $15,000 income in urban areas and in central cities. Increases in Internet access across all income levels in other areas were lower, but all showed improvement. In urban areas, for example, Internet access among households with incomes between $15,000 and $24,999 grew 87% in 2000 over their 1998 access rates. Central city households, however, had lower increases than rural areas. The household income brackets with the highest percentage increases were the group with less than $15,000 income, which achieved a 75% increase, to a 13.5% penetration level, and the group between $15,000 and $24,999, which had a 61% increase, achieving a 20.7% access level for 2000.
Low-Income Households Show Computer Ownership Gains
Almost one-fifth (19.2%) of households in the lowest income bracket (under $15,000 per year) now own computers, an increase of 4.7 percentage points from the 14.5% figure in December 1998. Overall, households at the lowest income levels increased their ownership of computers by approximately one-third in August 2000 over the December 1998 levels.
At other income levels, 30.1% of households in the $15,000-$24,999 bracket had computers in 2000, a 27% increase over 1998. The next fastest growing income bracket for computer penetration was the $25,000-$34,999 bracket. In that group, 44.6% of households owned a computer, an increase of 25% from the 35.8% penetration rate in 1998. For all three income categories above $35,000 rural households were as likely as their urban peers to have a computer at home. At income levels of more than $75,000, 86.3% of households had a computer, up from 79.9% in 1998. The ownership rate in central cities (83.7%) trailed the national average at that income.
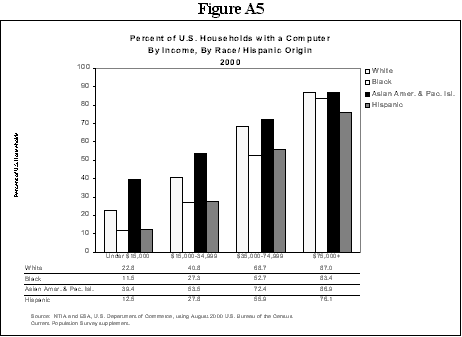
Data relating to computer ownership by income can be found in the Appendix, Figures A3 and A5.
Home computer and Internet access rates vary by the education level of the reference person or householder (a person residing in the housing unit who owns it or is responsible for its rent). Better educated adults are more likely to use and become familiar with computers and the Internet at work or through their school experiences. In December 1998, 53.0% of households headed by a person with education beyond college had Internet access. That surpassed the access rate for households headed by a person with a bachelor's degree (46.8%), those with some college experience (30.2%), those with a high school diploma (16.3%), and those with less than a high school diploma (5.0%).
The same patterns existed in August 2000, although rates soared for all educational levels in the prior 20 months. Of households headed by someone with post-college education, 69.9% had Internet access. That compares to households headed by someone with a college degree alone (64.0%), those with some college experience (49.0%), those educated beyond high school but no college degree (29.9%), and those with less than a high school degree (11.7%).
The 1998-2000 expansion rates were highest for those at lower levels of education. For example, Internet access expanded by 134% for those with less than a high school education, by 62% for those with some college, and by 32% for those with post college education.
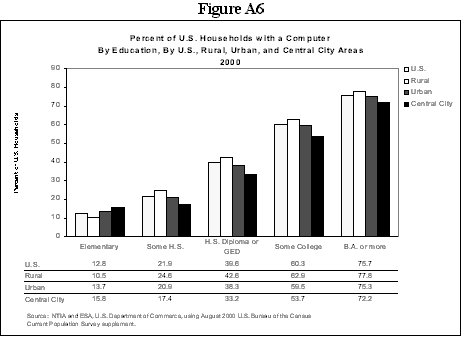
The median level of education among adult family heads is some college. This group had a larger point gain over 20 months (19 points) than households in the two higher education categories with 17 point gains each. Data relating to Internet access and computer ownership by education level can be found in the Appendix, Figures A6 and A12.
The interplay between education and income levels is worth examining more closely. Although both of these factors correlated with Internet access, as we have seen, they are also linked to each other. In terms of home Internet access rates, the ratio of the highest group to the lowest is more than five to one for both the income and education categories in Table I-2. Since the two are so correlated, we have examined whether just one factor is dominant and the other represents a misleading correlation, or whether both are independently associated with Internet access.
Figure I-9 presents some evidence that both income and education are independently associated with Internet access. Although the average Internet access rate for incomes of $75,000 and greater is 77.7%, it ranges from 82% for those with a college degree or more down to 51% for those with less than a high school education. Likewise, households with incomes between $15,000 and $34,999 had an average access rate of 28%, ranging from 46% for college or more down to 11% for less than high school. The same wide disparities occur within education categories. For example, among households in which the householder had some schooling beyond high school but not a college degree, home Internet access reached 76% in the over $75,000 income group but only 26% in the under $15,000 income group. Among households with incomes below $15,000 and less than a high school education, only 4% had Internet access at home.
Once again, groups with higher initial penetration rates generally had large point gains but lower than average expansion rates, as shown in Table I-2. Those with the lowest incomes and education had much lower initial home Internet rates in 1998; however, they had the largest expansion rates. Although the expansion rate for the country was 58%, no group with post high school education and incomes above $35,000 had expansion rates that large. Among those with at least a college degree, only those with the lowest household incomes had expansion rates above the national average.
The largest point gains (between 20 to 22 points) were registered by those with incomes above $75,000 and less than a college degree and those with $35,000 to $74,999 in income and some college education. Indeed, households with incomes more than $75,000 and at least a college degree have reached the flattening stage of the "S-Curve." Their 16.3 point gain leaves that group so close that they would hit 100% in less than two years if they continued at the recent pace.
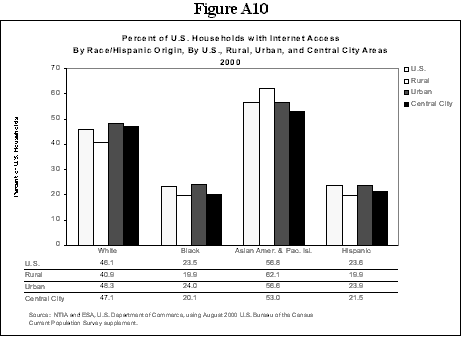
Between December 1998 and August 2000, there has also been a surge in uptake of Internet and computer access among households of different ethnic and racial origins.
Households of Asian Americans and Pacific Islanders have maintained the greatest Internet penetration at 56.8% in 2000. This group has also experienced the most dramatic growth in home Internet access in the last two years: an increase of 20.8 percentage points (from 36.0% in 1998). White households continued to have the second highest rate of access at 46.1% and experienced a growth of 16.3 percentage points (from 29.8% in 1998).
At the other end of the spectrum, Black and Hispanic households continue to experience the lowest Internet penetration rates (at 23.5% and 23.6%, respectively). Internet uptake by Black and Hispanic households has been strong in the last two years, however, as shown in Figure I-11. Between December 1998 and August 2000, access among Black households doubled from 11.2% in 1998 to 23.5% in 2000, a gain of 12.3 percentage points. Hispanic households' access increased 11 percentage points (from 12.6% in 1998 to 23.6% in 2000).
There is significant variation in Internet access and computer ownership within subgroups of these broad categories. For example, although Asian Americans and Pacific Islanders have high rates of connectivity as a group, there are subgroups that have lower rates of access due to lower income levels, educational attainment, or other reasons. By the same token, Blacks and Hispanics have high levels of connectivity despite lower rates overall.
This report does not include separate data on American Indians, Aleuts, and Eskimos (AIAE) because the sampled population from that group is too small for credible results.(7)
Although the percentage point change for Blacks and Hispanics was not as high as that for Asian Americans and Pacific Islanders or Whites, their rates of growth between 1998 and 2000 were striking. Internet access among Black households more than doubled (a 110% increase) between 1998 and 2000, while Hispanic households' access grew 87% in the same period. This compares to a growth rate of 55% for White households and 58% for Asian American and Pacific Islanders households.
Internet access among racial and ethnic groups continues to differ by geography and income level. With regard to geography, almost all groups had a slightly higher Internet penetration rate in urban areas (48.3% for Whites, 24.0% for Blacks, and 23.9% for Hispanics). Groups in rural areas, on the other hand, have experienced significantly lower penetration rates (40.9% for Whites, and 19.9% for Blacks and Hispanics). The survey's sample of rural Asian Americans and Pacific Islanders is too small for valid comparisons with their urban counterparts.
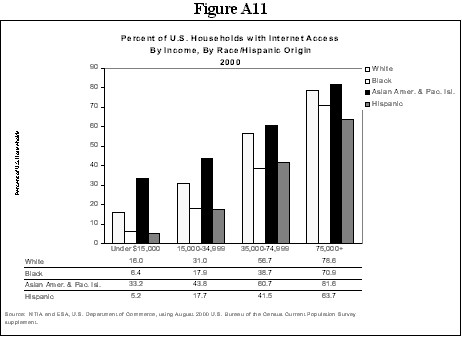
Income also affects whether households of different ethnic and racial backgrounds have Internet access. Households earning above $75,000 are highly likely to have Internet access (78.6% for Whites, 70.9% for Blacks, 63.7% for Hispanics, and 81.6% for Asian Americans and Pacific Islanders). The rates of connectivity decline significantly as income declines, although less so for Asian American and Pacific Islander households. While Hispanics and Blacks are particularly unlikely to have Internet access at incomes below $15,000 (5.2% and 6.4%, respectively), 33.2% of Asian American and Pacific Islander households in that lowest income bracket have Internet access.
Because income and education are so highly correlated with whether households have Internet access, the question arises as to whether those factors might fully explain the observed gaps between the national average and the rates for Blacks and Hispanics. Those two groups as a whole have lower incomes and lower education levels than the national average.
Differences in overall income and educational levels of Blacks and Hispanics do not fully account, however, for their lower levels of home Internet access. After adjusting for the effects of lower average income and educational attainment with shift-share analysis,(8) we observe that: (1) a third to a half of the gap remains; (2) both groups made roughly the same gains over the last 20 months as the national average; and (3) both groups, on this adjusted basis for August 2000, had substantially surpassed the national average for December 1998. Figure I-12 depicts the results of this shift-share analysis. In August 2000, both Blacks and Hispanics had home Internet access 18 points below the national average. The effects of having levels of income and education lower than the national average, however, accounted for 9 percentage points of the gap for Blacks and for 12 percentage points of the gap for Hispanics.
Over the 20 months from December 1998 to August 2000, the share of homes online rose by 12 points for Blacks, by 11 points for Hispanics and by 15 points for the country as a whole. However, on an income- and education-adjusted basis, Blacks and Hispanics each rose by 14 points, which is essentially equivalent to the national gain. The 32% penetration rates for Blacks and the 36% for Hispanics on an adjusted basis for August 2000, while far short of the national average of 42%, were both well above the national rate of 26% in December 1998.
Data relating to Internet access among households of different races and ethnic origins can be found in the Appendix, Figures A10-A11.
Substantial disparities have continued to widen, both when comparing Blacks and Hispanics against the national average and when comparing them against Whites. The divide between the Black household Internet access rate and the national average rate increased 3.0 percentage points, from 15.0 percentage points in December 1998 to 18.0 percentage points in August 2000. The divide between Hispanic households and the national average rate increased 4.3 percentage points, from 13.6 percentage points in December 1998 to 17.9 percentage points in August 2000.
A similar widening occurred between racial groups. Between October 1997 and December 1998, the gap in Internet access between White and Black households grew 5.1 percentage points, from a 13.5 percentage point difference in 1997 to a 18.6 percentage point difference in 1998. In the 20- month period between December 1998 and August 2000, the divide between White and Black households increased 4 percentage points, resulting in a percentage point difference of 22.6 points between White and Black households. The gap between White and Hispanic households grew 4.7 percentage points between 1997 and 1998, and then continued to widen even further (by 5.3 percentage points) between 1998 and 2000.
Between Asian Americans and Pacific Islanders and Whites, the gap grew from 6.2 percentage points in 1998 to 10.7 percentage points in 2000. No 1997 data are available for Asian Americans and Pacific Islanders.
While this measure of the Internet divide continued to widen, the high rates of expansion for Blacks and Hispanics suggest that, in time, this widening will subside. If computer ownership provides any pattern, we may soon see some stabilization and perhaps even narrowing of the Internet divide.
The Computer Divide Has Stabilized
Households of different ethnic and racial backgrounds also had disparate rates of ownership of computers. As with Internet access, households of Asian Americans and Pacific Islanders continue to exhibit the highest penetration rates (65.6%), followed by White households (55.7%), Hispanics (33.7%), and Blacks (32.6%).
All ethnic groups experienced comparable increases in computer penetration since 1998: ownership in 2000 was 10.6 percentage points higher for Asian Americans and Pacific Islanders, 9.4 percentage points higher for Blacks, 9.1 points higher for Whites, and 8.2 points higher for Hispanics.
As with Internet access, computer ownership is strongly influenced by income. Households earning more than $75,000 are consistently likely to own computers: 87.0% for White households, 86.9% for those of Asian Americans and Pacific Islanders, 83.4% for Blacks, and 76.1% for Hispanics. The computer divide becomes more pronounced at lower income levels, although less so for households of Asian Americans and Pacific Islanders. At incomes less than $15,000, Black households and Hispanic households are particularly unlikely to have computers (11.5% and 12.5%), compared to White households (22.8%) and Asian American and Pacific Islander households (39.4%).
Geography also plays a role in a household's likelihood of owning a computer. In general, households in rural areas are less likely to own computers (51.8% for Whites, 28.8% for Hispanics, and 27.5% for Blacks), while households in urban areas exceed the national average (57.3% for Whites, 34.2% for Hispanics, and 33.3% for Blacks).
Perhaps most significantly, the data show that the digital divide regarding computer penetration has stabilized. Large gaps remain between the share of Black and Hispanic households with a computer and the national average, but the gaps did not widen from 1998 to 2000. The divide between the percent of Black households with a computer and the national average rate declined 0.5 percentage points, from 18.9 percentage points in December 1998 to 18.4 percentage points in August 2000. The divide between the percent of Hispanic households with a computer and the national average rate increased 0.7 percentage points, from 16.6 percentage points in December 1998 to 17.3 percentage points in August 2000.
Because computer penetration for White, Black, and Hispanic households increased by comparable amounts, the gaps in computer penetration when comparing these groups of households have also stabilized. The gaps widened from 1994 to 1998, but did not widen further from 1998 to 2000.
Data relating to computer ownership among households by race and Hispanic origin can be found in the Appendix, Figures A4-A5.
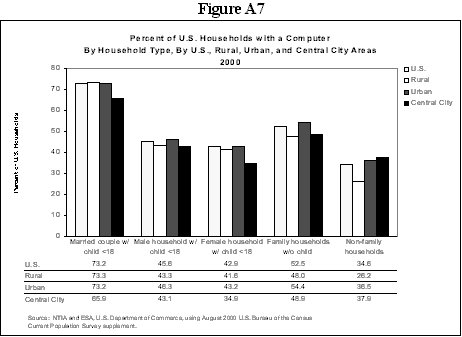
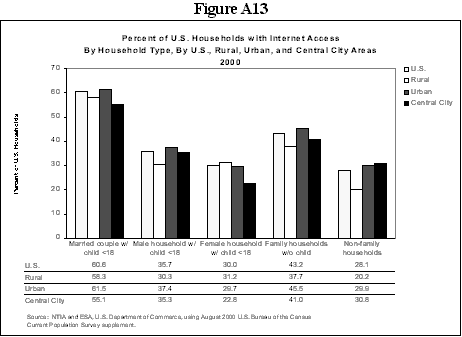
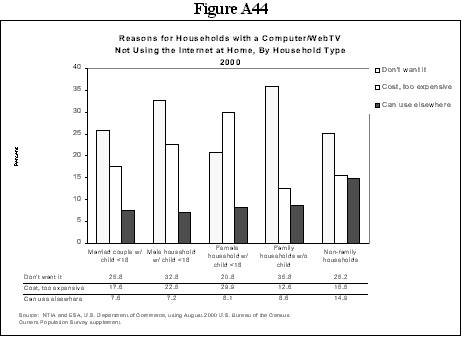
The makeup of a household --such as the presence or absence of children, and whether there are one or two parents-- is also associated with that household's likelihood of having computer and particularly Internet access. Even here, however, single-parent households have made great strides since December 1998, and are catching up to dual-parent households at higher income levels. Data relating to Internet access and computer ownership by household type can be found in the Appendix, Figures A7 and A13.
Internet Access is Highest for Households with Two Parents, Although Single Parent Households are Making Gains
Households with two parents and children have much higher rates of Internet access than other family types. As in 1998, married couples with children under 18 were far more likely to have Internet access (60.6%) than married couples without children (43.2%). This high connectivity rate for couples with children holds true regardless of whether they live in urban areas (61.5%), rural areas (58.3%), or central cities (55.1%). Those in "non-family households" (single or unmarried people), on the other hand, are the least likely to have Internet access (at 28.1%). Of all household types, non-family households in rural areas are the least likely to have Internet access (20.2%).
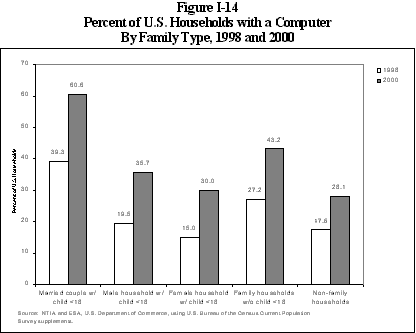
Having one or two parents is also related to whether a family has Internet access. Two-parent households are nearly twice as likely to have Internet access as single-parent households (60.6% for dual-parent, versus 35.7% for male-headed households with children less than 18 years of age, and 30.0% for female-headed households with children less than 18 years of age). Female-headed households in central cities are particularly unlikely to have Internet access (22.8%), as are male-headed households in rural areas (30.3%).
The differences among household types are most distinct at the middle income levels. At incomes below $15,000, on the other hand, the disparities diminish somewhat: 19.7% for dual-parent households; 14.5% for male-headed households; 12.6% for female-headed households; 13.5% for family households without children; and 11.4% for non-family households. Similarly, the gap narrows at incomes above $75,000: 84.4% for dual-parent households; 69.4% for male-headed households; 67.9% for female-headed households; 74.5% for family households without children; and 68.4% for non-family households.
While single parents trail significantly behind two-parent households in Internet access, they have shown the most change since 1998. Connectivity among female-headed households doubled between 1998 and 2000 (from 15.0% to 30.0%). Connectivity among male-headed households also grew substantially (by 83%) from 19.5% in 1998 to 35.7% in 2000. In time then, the gap between single and dual-parent households may close, as is already becoming apparent at the highest income level.
Computer Penetration Highest for Dual-Parent Households at Highest Income Level
As with Internet access, computers are far more likely to be in households with children and two parents. Married couples with children under 18 years of age own computers at much higher rates (73.2%) than married couples without children (52.5%), male-headed households (45.6%), female-headed households (42.9%), or "non-family" (single or unmarried) households (34.6%). Despite these differences, the disparities among these groups are less dramatic than with Internet access, perhaps because computers are more prevalent as an older and more widely-adopted technology. As with Internet access, single-parent families have also shown the greatest rate of growth in the last two years (30.3% for male-headed households, and 35.3% for female-headed households), suggesting that the gap between dual-parent and single-parent families may begin to close in time.
Again, we find differences by location. Female-headed households and male-headed households in central cities are much less likely to own computers (34.9% and 43.1%, respectively) than those in rural or urban areas. By contrast, computer penetration declines in rural areas for households without children (48.0% for family households without children, and 26.2% for single/unmarried households).
Computer ownership also varies by income. Particularly notable is the high penetration rate of computers in families earning $75,000 or more. Dual-parent families in this high-income bracket have a 93.1% penetration rate. That is, nearly every household falling into this group has a computer. Computer penetration is also high for other household types at this income level: 84.2% for male-headed households; 82.3% for female-headed households; 82.8% for households without children; and 76.6% for non-family households.
Computer penetration drops dramatically at the lowest income levels for almost all households types. The significant exception is for married couples with children: one-third (33.3%) of these families still own computers even at incomes below $15,000. This relatively high penetration rate suggests that computers are becoming an affordable and desirable purchase for many families, even for those in the lowest income bracket.
HOUSEHOLDS WITH COMPUTERS AND INTERNET ACCESS BY STATE
The figures on home computer and Internet access at the state level also show wide disparities but remarkably strong growth throughout the country. (Tables I-A and I-B) The gap between the top tier of states and the bottom tier has narrowed for computers and it has remained roughly stable for Internet access.
In December 1998, computer ownership ranged from percentages in the low 60s for the top tier of states to the 26% to 28% range for the bottom tier of states. By August 2000, a few states had reached computer ownership percentages in the mid-60s while no state was estimated to have fewer than 37% of homes with computers. Thus, the range between the highest states and the lowest states narrowed by about 10 percentage points, from the high 30s to the high 20s.
Internet penetration rates for December 1998 were estimated as low as the 14% to 18% range (Arkansas, Mississippi, Louisiana, and West Virginia), while four states (Colorado, New Hampshire, Utah, and Washington) had reached the 35% to 37% range. Alaska was estimated at 44%. By August 2000, estimates for six states had reached at least 50% (Alaska, Colorado, Connecticut, Delaware, New Hampshire, and Oregon) and only two states were estimated below 30% (Arkansas and Mississippi). As found for the groups with the lowest penetration rates in terms of income, education, and race/ethnicity, some of the lowest state penetration rates were found to have doubled over this 20 month period.
Table I-A. Percent of Households with Computers, by State: 2000
(Numbers in thousands.)
| State | Total Households | Percent with Computers | 90% Confidence Interval |
| Alabama | 1,742 | 44.2 | 2.83 |
| Alaska | 219 | 64.8 | 2.96 |
| Arizona | 1,832 | 53.5 | 2.70 |
| Arkansas | 1,041 | 37.3 | 2.72 |
| California | 12,129 | 56.6 | 1.20 |
| Colorado | 1,636 | 62.6 | 2.73 |
| Connecticut | 1,235 | 60.4 | 3.29 |
| Delaware | 290 | 58.6 | 3.21 |
| Florida | 6,235 | 50.1 | 1.48 |
| Georgia | 3,066 | 47.1 | 2.52 |
| Hawaii | 386 | 52.4 | 3.61 |
| Idaho | 491 | 54.5 | 2.71 |
| Illinois | 4,566 | 50.2 | 1.74 |
| Indiana | 2,347 | 48.8 | 2.86 |
| Iowa | 1,136 | 53.6 | 2.95 |
| Kansas | 1,010 | 55.8 | 2.96 |
| Kentucky | 1,614 | 46.2 | 2.82 |
| Louisiana | 1,650 | 41.2 | 2.78 |
| Maine | 508 | 54.7 | 3.13 |
| Maryland | 2,076 | 53.7 | 3.04 |
| Massachusetts | 2,407 | 53.0 | 2.17 |
| Michigan | 3,709 | 51.5 | 1.86 |
| Minnesota | 1,799 | 57.0 | 2.91 |
| Mississippi | 1,059 | 37.2 | 2.81 |
| Missouri | 2,155 | 52.6 | 2.98 |
| Montana | 360 | 51.5 | 2.79 |
| Nebraska | 637 | 48.5 | 3.04 |
| Nevada | 690 | 48.8 | 2.99 |
| New Jersey | 3,091 | 54.3 | 1.92 |
| New Hampshire | 474 | 63.7 | 3.22 |
| New Mexico | 667 | 47.6 | 2.89 |
| New York | 6,971 | 48.7 | 1.34 |
| North Carolina | 3,047 | 45.3 | 2.07 |
| North Dakota | 246 | 47.5 | 3.01 |
| Ohio | 4,351 | 49.5 | 1.81 |
| Oklahoma | 1,338 | 41.5 | 2.69 |
| Oregon | 1,280 | 61.1 | 2.99 |
| Pennsylvania | 4,720 | 48.4 | 1.68 |
| Rhode Island | 402 | 47.9 | 3.23 |
| South Carolina | 1,557 | 43.3 | 2.98 |
| South Dakota | 289 | 50.4 | 2.87 |
| Tennessee | 2,220 | 45.7 | 2.90 |
| Texas | 7,353 | 47.9 | 1.52 |
| Utah | 707 | 66.1 | 2.76 |
| Vermont | 242 | 53.7 | 3.21 |
| Virginia | 2,722 | 53.9 | 2.74 |
| Washington | 2,323 | 60.7 | 2.93 |
| Washington, DC | 254 | 48.8 | 2.97 |
| West Virginia | 744 | 42.8 | 2.65 |
| Wisconsin | 2,031 | 50.9 | 2.86 |
| Wyoming | 193 | 58.2 | 2.91 |
Table I-B. Percent of Households with Internet Access, by State: 2000
(Numbers in thousands.)
| State | Total Households | Percent with Internet | 90% Confidence Interval |
| Alabama | 1,742 | 35.5 | 2.73 |
| Alaska | 219 | 55.6 | 3.08 |
| Arizona | 1,832 | 42.5 | 2.68 |
| Arkansas | 1,041 | 26.5 | 2.49 |
| California | 12,129 | 46.7 | 1.21 |
| Colorado | 1,636 | 51.8 | 2.82 |
| Connecticut | 1,235 | 51.2 | 3.37 |
| Delaware | 290 | 50.7 | 3.26 |
| Florida | 6,235 | 43.2 | 1.46 |
| Georgia | 3,066 | 38.3 | 2.46 |
| Hawaii | 386 | 43.0 | 3.58 |
| Idaho | 491 | 42.3 | 2.69 |
| Illinois | 4,566 | 40.1 | 1.71 |
| Indiana | 2,347 | 39.4 | 2.79 |
| Iowa | 1,136 | 39.0 | 2.88 |
| Kansas | 1,010 | 43.9 | 2.96 |
| Kentucky | 1,614 | 36.6 | 2.72 |
| Louisiana | 1,650 | 30.2 | 2.59 |
| Maine | 508 | 42.6 | 3.11 |
| Maryland | 2,076 | 43.8 | 3.03 |
| Massachusetts | 2,407 | 45.5 | 2.16 |
| Michigan | 3,709 | 42.1 | 1.84 |
| Minnesota | 1,799 | 43.0 | 2.91 |
| Mississippi | 1,059 | 26.3 | 2.56 |
| Missouri | 2,155 | 42.5 | 2.95 |
| Montana | 360 | 40.6 | 2.74 |
| Nebraska | 637 | 37.0 | 2.93 |
| Nevada | 690 | 41.0 | 2.94 |
| New Hampshire | 474 | 56.0 | 3.33 |
| New Jersey | 3,091 | 47.8 | 1.92 |
| New Mexico | 667 | 35.7 | 2.78 |
| New York | 6,971 | 39.8 | 1.31 |
| North Carolina | 3,047 | 35.3 | 1.99 |
| North Dakota | 246 | 37.7 | 2.93 |
| Ohio | 4,351 | 40.7 | 1.78 |
| Oklahoma | 1,338 | 34.3 | 2.59 |
| Oregon | 1,280 | 50.8 | 3.07 |
| Pennsylvania | 4,720 | 40.1 | 1.64 |
| Rhode Island | 402 | 38.8 | 3.15 |
| South Carolina | 1,557 | 32.0 | 2.81 |
| South Dakota | 289 | 37.9 | 2.78 |
| Tennessee | 2,220 | 36.3 | 2.80 |
| Texas | 7,353 | 38.3 | 1.48 |
| Utah | 707 | 48.4 | 2.92 |
| Vermont | 242 | 46.7 | 3.22 |
| Virginia | 2,722 | 44.3 | 2.73 |
| Washington, DC | 254 | 39.6 | 2.90 |
| Washington | 2,323 | 49.7 | 3.00 |
| West Virginia | 744 | 34.3 | 2.54 |
| Wisconsin | 2,031 | 40.6 | 2.81 |
| Wyoming | 193 | 44.1 | 2.93 |
A NEW DIMENSION: HIGH-SPEED INTERNET ACCESS
One of the bonanzas of rapid technological change has been the development of infrastructure featuring wider bandwidth and faster transmission speeds. This diffusion of the higher-speed access services, generally classified as "broadband," has only just begun.(9) This year's report presents the results from the first systematic data collection on user access to high-speed broadband service that has been undertaken in a large scale personal interview survey with a very high response rate.(10)
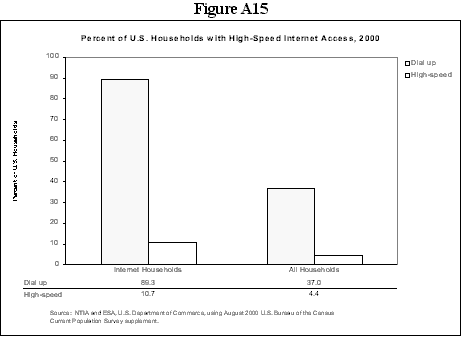
In August 2000, 10.7% of online households (4.4% of all U.S. households) had broadband-speed access. The remaining 89.3% of online households (37.0% of all U.S. households) connect to the Internet by regular dial-up phone service.
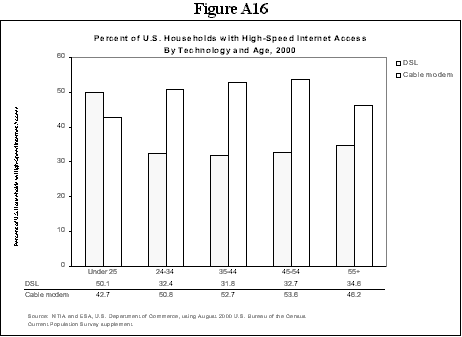
Among total broadband households, the overwhelming majority procured either cable modems (50.8%) or DSL (33.7%) (See Figure I-15). Wireless and satellite (4.6%) and other telephone-based technologies such as ISDN (10.9%) accounted for much lower percentages. Broadband preferences can vary, however, by demographic characteristics. The youngest householders (25 years and younger) prefer DSL (50.1%) over cable modems (42.7%), whereas other age groups use relatively more cable modems than DSL. Location also matters: in central cities, DSL (38.2%) and cable modem (44.2%) penetrations are relatively close; this contrasts with urban broadband households (which includes central cities and the suburbs), where the cable modem rate (51.1%) significantly exceeds that for DSL (33.6%). Regions also produce some wide variations. For example, the West demonstrates a balance between its DSL (43.1%) and cable modem (41.9%) diffusion; this contrasts with the Northeast's clear preference for cable modems (62.7%) over DSL (24.5%).(11)
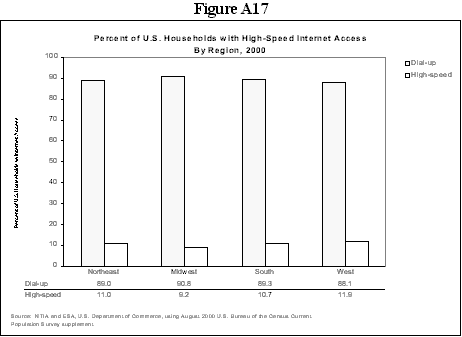
Broadband penetration differs by location as shown in Figure I-16: central city (12.2%) vs. urban (11.8%) vs. rural (7.3%) vs. U.S. (10.7%). Regional variations occur, as well: the West (11.9%) surpasses the Midwest (9.2%), while the Northeast (11.0%) and South (10.7%) rank between the two. The West has both the nation's highest rate for central city areas (13.0%) and the lowest rate for rural environs (5.9%).
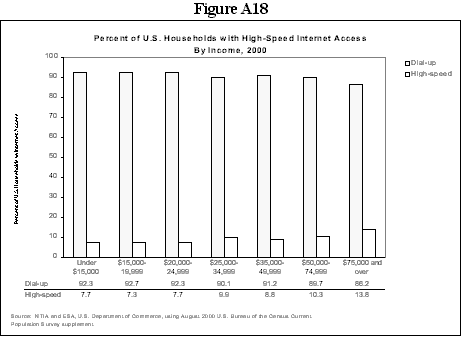
The penetration rate generally rises as household income increases because broadband access costs more than regular dial-up Internet access. Among those online households with family income under $15,000, less than 7.7% selected faster access modes. Conversely, the most affluent households (with incomes $75,000 and greater) exhibit the highest proportion of broadband at 13.8%, or about 180% of the low-income penetration rate. The lowest bracket (under $5,000) breaks the pattern, yielding one of the highest percentages (9.9%); this may reflect the presence of students who desire higher transmission speeds for school or simply attach a higher priority to faster access.
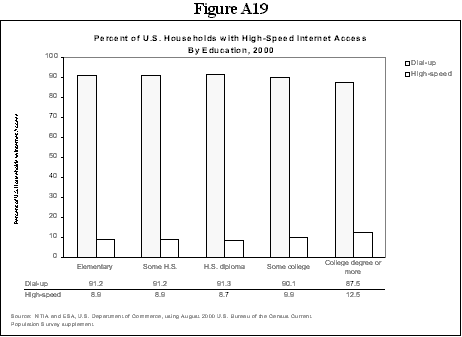
Educational attainment above the level of high school also affects broadband percentages. Those with college degrees (12.5%) exceed the national penetration rate for all households (10.7%). The households where education levels were high school or less trailed substantially with rates less than 9%. Householders with at least some college (9.9%) ranked in between the two extremes but below the national average.
Purchase of faster transmission rates tends to be inversely related to age. The youngest householders boast the highest broadband penetration (12.3%) --perhaps reflecting the student factor--while seniors rank the lowest (9.0%). Interestingly, the age group between 45 and 54 can claim one of the highest penetration rates (11.2%). Internet access speeds vary by race and origins as well, with minorities registering both the highest and lowest diffusion rates. Asian American and Pacific Islander households have the highest broadband rate (11.7%), followed by Whites (10.8%). Blacks (9.8%) and Hispanics (8.9%) rank lowest.
Household type has some correlation with broadband access rates. Male householders with children ranked highest (12.6%), while female-headed families ranked lowest (8.2%). Two-parent families and families without children both exhibited broadband penetrations (10.6%) approximating the national average; non-family households (11.7%) exceeded this average by a full percentage point.
As of August 2000, 41.5% of the Nation's 105 million households, or 43.6 million homes, had Internet access. Thus, 58.5% of households (61.6 million) were not connected electronically. In contrast, in December 1998 there were 76.5 million unconnected households (73.8%). This movement represents a substantial decline in both the proportion (15.3 percentage points) and number (a drop of 14.9 million) of non-Internet households relative to 20 months earlier.
As of August 2000, the number of households that had computers but no Internet access was 10.1 million, down from 16.5 million in December 1998, a decline of 39%. During that time frame, the proportion of PC households without access fell from 37.8% to 18.8%.
A household may not be connected to the Internet for a number of reasons. In terms of its historical experience, a household may have never been connected, or it may have decided to discontinue its Internet use. We address these situations below.
WHY HOUSEHOLDS WITH COMPUTERS HAVE NEVER HAD INTERNET ACCESS
Within computer households, there are a number of households that have never had an Internet connection. In August 2000, these households totaled 8.7 million. This figure represents a sizeable decline from December 1998, when the count equaled 14.4 million, a drop of 40%.
During the 2000 survey, "never-connected" households provided a number of reasons for not accessing the Internet at home (See Figure I-17). The most dominant reason was "don't want it" (30.8%). The second most common response: "cost, too expensive" (17.3%). Other leading reasons for non-access included "can use elsewhere" (10.4%), "not enough time" (9.1%), and "computer not capable" (6.7%). These data are similar to the breakdown reported from the December 1998 data, which found the reasons to be: don't want (25.7%) followed by reasons of cost (16.8%), use elsewhere (9.6%), and no time (8.7%). In fact, the proportions for these major categories remained basically the same, with the notable exception of the top (don't want it) category, which increased by 5 percentage points.
Not surprisingly, for low-income households, cost prevailed as the most important reason for never connecting. For those households under $15,000, one-third of respondents (32.6%) cited cost, and slightly more than one-quarter cited "don't want it" (26.6%). In contrast, the over-$75,000 bracket reversed the order of importance: "don't want it" (30.0%) surpassed cost (9.4%). The cost/don't-want-it nexus occurred at $20,000: those brackets below this threshold ranked cost number one, while those above placed "don't want it" first.
Cost affected other groups that have a computer but never had online access, as well. For example, more than one in four (26.1%) of the youngest householders (under 25 years of age) regarded Internet connectivity as too expensive, rating it over "don't want it" (19.1%) as the primary reason for non-access in their households. Female householders with children also pointed to cost as the most important reason for non-access, with 29.9% of respondents citing this factor versus 22.5% stating that they "don't want it."
Unlike youngest householders, those in other age brackets regarded "don't want it" as more important than cost; this was particularly true for seniors (55 years and older), where "don't want it" (40.4%) significantly outranked cost (14.5%). All major race/ethnic groups regarded "don't want it" as more important than the cost factor. This pattern holds for Whites (31.5% vs. 16.4%), Asian Americans and Pacific Islanders (30.4% vs. 13.0%), and Blacks (31.4% vs. 18.2%); it also holds for Hispanics but the differential is much less (25.5% vs. 23.7%).
The same relative rankings of "don't want it" vs. cost occurred when viewed by levels of educational attainment: the difference is most pronounced for those householders with college degrees (29.3%, 11.6%), some high school (36.9%, 20.4%), or a high-school diploma (32.9%, 17.4%), and least for some college (28.3%, 20.4%). All household types except female-headed families had the same relative rankings, with male householders with children (36.5%, 22.5%) dramatically reversing the order from the 1998 survey (18.7%, 23.2%). While employed households (27.8%, 17.7%) continued the pattern established in December 1998 (23.5%, 16.5%), unemployed households (30.9%, 28.9%) experienced a major swap of rankings compared to the previous survey (13.3%, 38.2%).
Data relating to households with computers not using the Internet can be found in the Appendix, Figures A41-A45.
In sum, the number and proportion of never-connected households with computers have decreased since December 1998. Overall, the most important reasons cited are "don't want it" and "cost, too expensive." The former has grown in importance for a number of groups, while cost remains the paramount reason for lower-income households and a few other groups.
WHY HOUSEHOLDS WITH COMPUTERS HAVE DISCONTINUED INTERNET ACCESS
In August 2000, there were 4.0 million Internet "drop-offs" (i.e, those households that once had but do not currently have electronic access). That number is essentially unchanged from the 4.1 million "drop-offs" in December 1998.
Respondents to the August 2000 survey cited several principal reasons for their households' decisions to discontinue their Internet access (See Figure I-18). The leading factor noted was "no longer owns computers" (17.0%). Next in importance were "can use anywhere" (12.8%) and "cost, too expensive" (12.3%). The other key reasons were "don't want it" (10.3%), "not enough time" (10.0%), and "computer requires repair" (9.7%). Also provided as reasons were "moved" (6.1%), "not useful" (4.2%), "problems with ISP" (2.9%), "concern with children" (2.3%), "not user friendly" (1.5%), and "computer capacity issues" (1.2%). "Other" reasons - those that are too heterogeneous to be included elsewhere-- were also given by respondents (9.8%).
These results reflect changes from the answers given in the December 1998 survey. In 1998, respondents identified "cost, too expensive" (15%) as the most important reason for dropping off the network. In 1998, the reason "no longer owns computer" ranked second (14%) and "can use anywhere" ranked fourth (9%). "Not enough time to use it" registered higher percentage (10% vs. 9%) in 2000 but slipped from third in 1998 to fourth in 2000. Respondents accorded "computer requires repair" about double the response rate from December 1998 (5%) to August 2000 but had the same ranking (sixth). "Don't want it" was the fifth most popular reason in 1998 (7%).
A more disaggregated look at the August 2000 survey results reveals additional insights. Data relating to discontinued Internet access can be found in the Appendix Table 1.
As a reason for discontinuing Internet access, "no longer owns a computer" ranked number one and cost is the number two reason for all income brackets except the highest ($75,000+). The most affluent income category respondents led with "can use elsewhere," "computer requires repair," "don't want it," and "not enough time."
Looking at different race and ethnic groups, "no longer owns computer" ranked highest for White households, followed by "can use elsewhere" and "cost." For Blacks, the ranking was "cost," "no longer owns," and "use elsewhere." Hispanic households cited "can use elsewhere," "no longer owns," and "cost."
Focusing on the level of educational attainment, the elementary education, some high school education, and some college education groups all identified the same two top reasons: "no longer owns computer" and "cost." The other two groups saw it differently. The high-school-degree group ranked cost first and "no longer owns" second. The college-degree group picked out "use elsewhere," followed by "no longer owns."
An examination of household types reveals some distinct differences. Married couples with children ranked "cost" and "not enough time" at the top of their list of major reasons. This contrasts with other household types, whose number one reason was "no longer owns computer": male householders with children, female householders with children, and non-family households.
All age categories except 35-44 year olds (for whom cost ranked first) rated "no longer owns computer" as the most important reason for disconnecting. The second-ranked reasons varied greatly: "can use elsewhere" for under-25 and 25-34 year olds; "computer requires repair" for 45-54 year olds; and "don't want it" for those householders at least 55 years old.
Although variations exist for some specific demographic groups, the August 2000 survey respondents generally identified an absence of a computer, reliance on other locations, and cost as the most important reasons for their households discontinuing their home Internet access. These reasons contrast with the responses of never-connected households, who cited "don't want it" as the most compelling reason for their non-access.
Percent of Households with a Computer, 1998 and 2000
| December 1998 | August 2000 | Point change | Expansion rate | |||
| All | 42.1 | 51.0 | 8.9 | 21.1 | ||
| White Non-Hispanic | 46.6 | 55.7 | 9.1 | 19.5 | ||
| Black Non-Hispanic | 23.2 | 32.6 | 9.4 | 40.5 | ||
| Asian Amer. & Pac. Isl. | 55.0 | 65.6 | 10.6 | 19.3 | ||
| Hispanic | 25.5 | 33.7 | 8.2 | 32.2 | ||
| Less than $15,000 | 14.5 | 19.2 | 4.7 | 32.4 | ||
| $15,000 - 24,999 | 23.7 | 30.1 | 6.4 | 27.0 | ||
| $25,000 - 34.999 | 35.8 | 44.6 | 8.8 | 24.6 | ||
| $35,000 - 49,999 | 50.2 | 58.6 | 8.4 | 16.7 | ||
| $50,000 - 74,999 | 66.3 | 73.2 | 6.9 | 10.4 | ||
| $75,000 and above | 79.9 | 86.3 | 6.4 | 8.0 | ||
| Less than High School | 12.5 | 18.2 | 5.7 | 45.6 | ||
| High School Graduate | 31.2 | 39.6 | 8.4 | 26.9 | ||
| Some College | 49.3 | 60.3 | 11.0 | 22.3 | ||
| College Graduate | 66.9 | 74.0 | 7.1 | 10.6 | ||
| Post Graduate | 72.2 | 79.0 | 6.8 | 9.4 | ||
| Rural | 39.9 | 50.4 | 10.5 | 26.3 | ||
| Urban | 42.9 | 51.5 | 8.6 | 20.0 | ||
| Central City | 38.5 | 53.7 | 15.2 | 39.5 | ||
| Bold indicates above the national average 8.9 point change and 21.1 % expansion rate. | ||||||
Percent of Households with Internet Access, 1998 and 2000
| December 1998 | August 2000 | Point change | Expansion rate | |||
| All | 26.2 | 41.5 | 15.3 | 58.4 | ||
| White Non-Hispanic | 29.8 | 46.1 | 16.3 | 54.7 | ||
| Black Non-Hispanic | 11.2 | 23.5 | 12.3 | 109.8 | ||
| Asian Amer. & Pac. Isl. | 36.0 | 56.8 | 20.8 | 57.8 | ||
| Hispanic | 12.6 | 23.6 | 11.0 | 87.3 | ||
| Less than $15,000 | 7.1 | 12.7 | 5.6 | 78.9 | ||
| $15,000 - 24,999 | 11.0 | 21.3 | 10.3 | 93.6 | ||
| $25,000 - 34.999 | 19.1 | 34.0 | 14.9 | 78.0 | ||
| $35,000 - 49,999 | 29.5 | 46.1 | 16.6 | 56.3 | ||
| $50,000 - 74,999 | 43.9 | 60.9 | 17.0 | 38.7 | ||
| $75,000 and above | 60.3 | 77.7 | 17.4 | 28.9 | ||
| Less than High School | 5.0 | 11.7 | 6.7 | 134.0 | ||
| High School Graduate | 16.3 | 29.9 | 13.6 | 83.4 | ||
| Some College | 30.2 | 49.0 | 18.8 | 62.3 | ||
| College Graduate | 46.8 | 64.0 | 17.2 | 36.8 | ||
| Post Graduate | 53.0 | 69.9 | 16.9 | 31.9 | ||
| Rural | 22.2 | 38.9 | 16.7 | 75.2 | ||
| Urban | 27.5 | 42.3 | 14.8 | 53.8 | ||
| Central City | 24.5 | 37.7 | 13.2 | 53.9 | ||
| Bold indicates above the average 15.3 point change and 58.4 % expansion rate. | ||||||
USE OF THE INTERNET BY INDIVIDUALS
As of August 2000, 116.5 million Americans were online--31.9 million more than only 20 months earlier. Internet users accounted for 44.4% of the U.S. population (age 3 and older), up from 32.7% in December 1998. This pattern of increasing Internet use held true at all income and education levels, for all age groups, for both men and women, for the employed and the unemployed and across all race and ethnic groups.
Groups that have historically been digital "have nots"--individuals who come from low-income households, individuals with low levels of education, minority groups (particularly Blacks and Hispanics), and older people--are participating in this dramatic increase in Internet usage, but their use rates remain below the national average.
Whereas Part I examined household access, this section examines individual use. The person-based data and household-based data yield related, but not identical, rates of Internet use for factors that are common to the two data sets, such as income and race. Why these differences occur is explained in Box II-1 on page 35. Person-based data offer an understanding of ways in which individuals use the Internet. They offer the ability to examine demographic characteristics, such as age and gender, that are unique to individuals with no logical correspondence at the household level. These data offer insight into where individuals use the Internet--at home, outside the home, or in multiple places. And, where individuals are using the Internet from a location away from their home, these data provide insight into where they are getting that access. Finally, these data offer some information about the activities that individuals are undertaking while they are online.
Key insights offered by these data include:
Person-based information is likely to become an even more important complement to the household-based measures in the future. We are already seeing the emergence of a world where Internet access is mobile, traveling with the individual rather than being a function of a physical place. For years, laptop computers have offered processing power and Internet access to individuals wherever they happened to be--at home, in the office, or in hotels across the globe. Mobile devices, such as personal digital assistants and mobile phones, now offer Internet access anywhere via wireless connections.
INTERNET USE AMONG INDIVIDUALS
Almost 32 million people became Internet users during the 20 months between December 1998 and August 2000. As Figure II-2 shows, Internet use increased across the age distribution. More people at all ages were using the Internet. This figure, however, also illustrates that although Internet use increased across the board, Internet use rates are not equal across all age groups. A person's age as well as factors such as household income, race/ethnicity, gender, educational attainment, and labor force participation matter in the Internet use equation. This section explores these factors.
Although Internet use is growing across the board, groups of different racial and ethnic backgrounds still use the Internet to differing degrees. (Figure II-4.) In August 2000, Whites (50.3%) continued to be the most likely to use the Internet, followed by Asian Americans and Pacific Islanders (49.4%), Blacks (29.3%), and Hispanics (23.7%).
Reviewing the data by race and Hispanic origin brings out the lack of close correspondence between the household-based measures of access to the Internet and the person-based measures of use. For example, although 56.8 percent of Asian American and Pacific Islander households had Internet access, only 49.4 percent of persons in that group were using the Internet. In contrast, the rates of personal use were higher for Whites and Blacks than their household connection rates. Among Whites, 46.1 percent of their households had online connections but 50.3% of Whites were Internet users at some location. The gap was even larger for Blacks: only 23.5% of their homes were online, but 29.3% of Blacks were Internet users. Only for Hispanics were the two percentages essentially the same at 23.6% and 23.7%, respectively.
Why do Whites have personal Internet usage rates similar to the rates for Asian Americans and Pacific Islanders despite having rates of household connections 11 points lower? Why do Blacks have household rates of Internet access comparable to Hispanics but much higher personal use rates? As delineated in Table II-9, three factors come into play: the relative family size of households with Internet access, the share of persons with home access who actually use the Internet at home, and the share of persons who use the Internet only outside the home. The difference in household size for online households is larger for Whites and Blacks. Whites also have the highest share of people who live in homes with Internet access who actually make use of that access, while Hispanics have the lowest share. Finally, Blacks have the highest share of people who access the Internet only outside the home (10.4%), followed by Whites at 8.6%. Only 7.5% of Hispanics and Asian Americans and Pacific Islanders use the Internet exclusively outside the home. (See Figure II-14.)
Underlying the closing aggregate gender gap are some gender differences by age. (Figure II-6.) For
both surveys, in the early years of life, boys and girls were equally likely to be Internet users. The
small gap in favor of females of college age widened by 2000. During the years of prime labor force
participation, while men were more likely than women to be Internet users in 1998, twenty months
later the situation had reversed--in August 2000 women were more likely than men to be Internet
users. For older adults in both surveys, men were more likely than women to be online.
In August 2000, males and females had very similar Internet use rates in all but one race/ethnic group--Asian Americans and Pacific Islanders. Among Asian American and Pacific Islanders, males had higher Internet use rates than females. (Figure II-7)
In both 1998 and 2000, Internet use rose with higher levels of education.(12) (Figure II-8.) Adults with no more than an elementary level of education had Internet use rates of less than 4%. People whose highest level of education was a bachelor's degree or higher had the highest Internet use (74.5%). The percentage point gain of this group (13 points between 1998 and 2000) was less than that of adults with only some college education (16 percentage points).
Young children, not surprisingly, had the lowest Internet use rate in 2000 (15.3%) and the smallest increase in use since 1998 (4.3 percentage points). In 2000, 15.7% of girls and 14.9 percent of boys in this age group were Internet users.
The race/ethnicity patterns track the national use rate patterns--Whites (18.5%), Asian American/Pacific Islanders (14.4%), Blacks (10.2%), and Hispanics (8.7%).
Internet use rates increase with household income. Young children from households with income less than $15,000 had an Internet use rate of 5.4% in 2000--9.9 percentage points behind the national average for this group. At the other extreme, households with incomes greater than $75,000 had an Internet use rate of 21.8%. (Table II-2.)
There was little difference in Internet use between boys (52.9%) and girls (53.9%) in 2000.
Again, race/ethnicity patterns were similar to the national average, with Whites (63.1%) and Asian Americans and Pacific Islanders (58.6%) showing higher use rates than Blacks (34.2%) and Hispanics (31.4%). Blacks, however, saw relatively rapid growth in their rate of Internet use (63%) from December 1998 to August 2000 compared with Asian Americans and Pacific Islanders (45%), Hispanics (33%), and Whites (20%).
Individuals who lived in households where income was less than $15,000 (28.8%) and those who lived in households where income was between $15,000 and $24,999 (36.3%) had Internet use rates below the national average. Individuals who lived in households where income was $35,000 or more had Internet use rates greater than the national average for this age group.
Individuals age 18 to 24 also had Internet use rates for both December 1998 (44.3%) and August 2000 (56.8%) that were above the national averages. (Table II-4.)
In this age group, women (59.6%) had higher Internet use rates than men (54.1%) in 2000.
In August 2000, the Internet use rates for Black (41.5%) and Hispanics (32.4%) in this age group were considerably higher than use rates for these race/ethnicity groups in the population at large. However, these groups still lag behind Whites (65.0%) and Asian American/Pacific Islanders (72.9%). Of these two groups, Blacks appear to be gaining ground relatively rapidly with a growth in the use rate of 55% over the 20 month period. This compares to 30% growth for Asian Americans and Pacific Islanders, 28% for Hispanics, and 25% for Whites.
In this age group, individuals at all household income levels had Internet use rates close to or above the Internet use rate for the population as a whole---less than $15,000 (41.9%), $15,000 to $24,999 (43.5%), $25,000 to $34,999 (52.4%), $35,000 to $49,999 (59.9%), $50,000 to $74,999 (67.4%), and $75,000 and above (78.2%). This flattening of the income gradient suggests that income is less important than other factors in Internet use among 18 to 24 year olds. (Figure II-10.)
Women were more likely than men to be Internet users regardless of labor force status, but the gap between the genders was larger for those not in the labor force. In 2000, 60.8% of women and 56.2% of men were Internet users among 25-49 year olds who were in the labor force. Among those not in the labor force in this age bracket, however, the use rate for women was 42.6% and the use rate for men was 28.6%.
Blacks and Hispanics were below the national average in Internet use regardless of labor force status, but Blacks and Hispanics who were not in the labor force were even further below the national average. For Blacks in the labor force, the use rate was 40.3%, but for those not in the labor force it was 18.9% in August 2000. Hispanics age 25 to 49 who were in the labor force had an Internet use rate of 29.8%, while those not in the labor force had a use rate of 16.5%. Among those not in the labor force, Blacks had 100% growth in their use rate over 1998 and Hispanics saw an 85% increase in their use rate. This is consistent with aggregate patterns of faster growth in the groups that are below the national average and growing from a smaller base.
Individuals who are over 50 years old are among the least likely to be Internet users. The Internet use rate in this group was only 29.6% in 2000. In August 2000, however, the rate for individuals age 50 and older who were still in the labor force (46.4%) was much closer to the 58.4% for 25 to 49 year olds who were in the labor force. This suggests that the lower Internet use for ages beyond 50 shown in Figure II-2 is associated with labor force attachment, as well as with age.
Labor force participation also affects the gender differences evident for individuals age 50 and older. In August 2000, men (46.0%) and women (46.8%) who were still in the labor force were equally likely to be Internet users. However, men (18.1%) had higher Internet use rates than women (15.6%) for those not in the labor force. This gender difference may result from higher previous labor force participation by men relative to women in this age group and from the larger number of women relative to men who are over 70 years old.
In August 2000, 25.0% of the population used the Internet only from home, an increase from 15.8% in December 1998. The share of the population using the Internet from both home and outside the home also increased, from 6.5% to 10.7%. In contrast, use from only outside the home declined from 10.5% to 8.7%. (Figure II-13.)
The aggregate pattern of primary and increasing Internet use from the home is not, however, consistent across demographic groups. (Figure II-14.) Although 8.7% of Internet users nationwide used the Internet only from outside their homes, 10.4% of Blacks used the Internet only from locations outside their home.
LOCATIONS OF INTERNET ACCESS OUTSIDE THE HOME
As stated, work was the most frequently reported site of outside the home Internet use for each of the race/ethnic groups. Asian Americans and Pacific Islanders (15.4%) and Whites (14.1%) reported having access to the Internet at work more often than Blacks (8.1%) and Hispanics (5.6%). On the other hand, Blacks (2.9%) and Asian Americans and Pacific Islanders (2.3%) were more likely to be using the Internet at public libraries than Whites (1.7%), and Hispanics (1.7%).
Men (13.2%) were more likely than women (11.6%) to report using the Internet at work.
The likelihood of reporting work as a place to use the Internet increases with household income. In August 2000, 2.1% of individuals whose household incomes were less than $15,000 reported using the Internet at work--10.2 percentage points behind the national average of 12.3%. As household incomes rose, so did Internet use at work--4.0% for individuals with household incomes between $15,000 and $24,999, 7.8% for individuals with household incomes of $25,000 to $34,999, and 11.1% for those with household incomes from $35,000 to $49,999. Individuals with household incomes between $50,000 to $74,999 (16.5%) and those with household incomes greater than $75,000 (29.6%) reported work use at rates higher than the national average.
Public libraries appear to be a more important place of Internet use for the unemployed than for those who had jobs. In August 2000, 4.2% of unemployed individuals reported using the Internet from the public library compared to 1.8% of employed individuals and 1.7% of those who were not in the labor force.
The most frequent online activity among Internet users in August 2000 was e-mail. (Figure II-15) About 80% of people with Internet access reported regularly using e-mail. More than half of the people online also used the Internet regularly to search for information. Making phone calls was the least common online activity; less than 6% of Internet users reported regularly using the Internet to make calls.
Online shopping and bill paying were not the most common of online activities--only 30% of Internet users reported regularly shopping or paying bills online in 2000. Nonetheless, this activity saw the greatest increase (52%) between December 1998 and August 2000.
ONLINE ACTIVITIES OF HOME INTERNET USERS
E-mail continues to be the most common use of the Internet among people who use the Internet at home.(15) In August 2000, 84.8% of people using the Internet at home used it for e-mail, up from the 77.9% in December 1998. In August 2000, one-third of Internet users shopped and paid bills online (33.6%), up from the almost one-quarter of the Internet population in 1998 (24.5%). Most other uses were relatively unchanged from December 1998. The percentage of those who went online to check news, weather, or sports, was about the same, at 46%, while those using the Internet to search for information hovered around 59%, and those using the Internet for job-related tasks remained about 28%.
As the near-universal application, e-mail use showed little variation across income and education categories. Use of the Internet for e-mail by home Internet users in the lowest income households were within a percentage point or two of those using the Internet in the highest income households--all were above 82%.
Looking at e-mail use from the perspective of education level, 90.1% of those with
a bachelor's degree or higher used the Internet for e-mail, but 80.1% of those with an elementary-school
education did, as well. In August 2000, 84.2% of those with some high school, but not a degree,
used e-mail.
The August 2000 data showed that more women (86.8%) used the Internet for e-mail than men (82.8%). More women (96.6%) used the Internet for communicating with friends and family than men (93.6%). More men (34.2%) than women (24.7%) used e-mail for job-related activities, and more men (34.4%) than women (28.8%) used e-mail for hobbies and other special interests.
Racial differences played a small role in how e-mail is used. More Blacks used e-mail at home for job-related activities than Whites (32.5% vs. 29%), and this was also the case for usage for educational purposes: 38.1% for Blacks vs. 25.9% for Whites.
Men and women differed slightly in their use for online shopping and bill paying: men (32.7%) and women (34.5%). Men used the Internet more for job-related tasks. In August 2000, 30.2% of men used it for that purpose in contrast to 24.4% of women. Men used the Internet more to check news (54.3%) than did women (38.0%), but women went online more often to take courses or do research for school, 34.6% contrasted with 30.8% for men. Men and women used the Internet equally in their searches for information, each about 58%.
Online shopping and bill paying has caught on particularly with 25 to 34 years olds. Nearly half of the people in this age group (47.7%) used the Internet for these activities. Thirty-five to forty-four year olds followed closely with a use rate of 42.9%.
Whites used the Internet for shopping and bill paying more than Blacks, 34.4% and 27.5% respectively. In addition, 16.4% of at home Internet users in 2000 went online to look for jobs, up from 14.5% in 1998.
ONLINE ACTIVITIES OF OUTSIDE THE HOME INTERNET USERS
The pattern of online activities by people who used the Internet outside the home differed from that of home users.(16) With the exception of job related activities, a smaller share of people who used the Internet outside the home reported engaging in each of the measured activities. Among Internet users outside the home, 50.2% were online for job-related tasks, an increase from 44.6% in 1998.
In 2000, 32.2% of people using the Internet from outside the home did so to take courses--down from 38.8% in December 1998. In 2000, 45.0% of people using the Internet did so to search for information; in 1998, the figure was 50.1%. People using the Internet outside the home to check news, sports, and weather also dropped slightly. On the other hand, e-mail use was up to 59.1% in 2000 from 53.6% in 1998. Online shopping and bill paying was 10.4% in 2000 up from 7.5% in 1998.
Outside the home, Whites were more likely to go online for e-mail than Blacks, 61% vs. 51%. Blacks were more likely to use the Internet outside the home than Whites to take a course (41% vs. 29.7%), and were more likely to use the Internet to search for jobs (14.7% vs. 7.2%).
In August 2000, an estimated 4.3 million people used the Internet outside the home to search for jobs. This represented 8.4% of the 50.9 million people who used the Internet away from home. Those with lower incomes were much more likely to search for jobs using the Internet. Among those with household incomes below $25,000 using the Internet away from home, more than 12% were searching for jobs, almost twice the 6.5% rate of those with incomes above $75,000. (Figure II-16.)
Reconciliation of Household Access and Individual Internet Use Rates for 2000
|
White |
Black |
Asian American & Pac.Islander |
Hispanic |
Total | |||
| 1 | Percent of households with Internet | 46.1 | 23.5 | 56.8 | 23.6 | 41.5 | |
| Average household size: | |||||||
| 2 | Households with Internet | 2.74 | 2.92 | 3.16 | 3.42 | 2.81 | |
| 3 | All households | 2.37 | 2.55 | 3.07 | 3.23 | 2.49 | |
| 4 | Ratio (Row 2 / Row 3) | 1.16 | 1.15 | 1.03 | 1.06 | 1.13 | |
| 5 | Access rate for persons who live in a household with Internet access (Row 1 x Row 4) | 53.3 | 26.9 | 58.6 | 25.0 | 46.7 | |
| 6 | Percent of persons living in a household with Internet who use it | 78.2 | 70.4 | 71.4 | 64.4 | 76.4 | |
| 7 | Use rate for persons who have Internet at home (Row 5 x Row 6) | 41.7 | 18.9 | 41.8 | 16.1 | 35.7 | |
| 8 | Percent of persons who use Internet only outside the home | 8.6 | 10.4 | 7.5 | 7.6 | 8.6 | |
| 9 | Access rate for persons who use Internet from any location (Row 7 + Row 8) | 50.3 | 29.3 | 49.3 | 23.7 | 44.4 | |
| Notes: Group quarters for households and persons are excluded. Numbers may not add exactly because of rounding. | |||||||
Part III
INTERNET ACCESS AND COMPUTER USE
AMONG PEOPLE WITH DISABILITIES
One important group whose levels of Internet access and computer use have not been discussed previously in this series of reports are those individuals who have a physical or mental disability. The periodic supplements to the Current Population Survey, on which the analysis in the preceding sections are based, offer only a very limited basis from which to consider this issue. Fortunately, a new research data file derived from a different survey, the Survey on Income and Program Participation (SIPP), conducted in late 1999 provides, for the first time, a detailed look at this subject (see Box III-1).
As the data presented below show, Internet access and computer use vary by disability status. People who have a disability were only half as likely to live in homes with Internet access than those without any disability. And while just under 25% of people without a disability have never used a personal computer, the situation is quite different for those who have a disability. Close to 60% of people who have at least one type of disability have never used a computer.
There are, however, differences in rates of access and use for specific disabilities. For example, people with learning disabilities have Internet access either from home or somewhere else at rates of over 40%, while people who are blind or vision impaired have Internet access rates closer to 20%.
The data also show that some of the variation apparent in the aggregate is the result of some fairly large differences in the economic and demographic distribution of the various populations with and without disabilities. When these factors are taken into account, some of the differences between those who have and those who do not have a disability narrow considerably. For example, employed people with and without disabilities are substantially more similar to each other in rates of Internet access and computer use than those who are not employed.
Even after attempting to account for some of these factors, however, differences remain in the rates of Internet access and computer use between people who have a disability and those who do not.(17)
Technology offers enormous potential to increase the rates of computer and Internet use among people with disabilities. But technology can also be an additional barrier if products are not designed to be accessible. Innovations in the private sector as well as support from public entities are helping to ensure that more people have access to the Information Age by developing hardware and designing Web sites that are accessible to and usable by everyone.
Analyzing the rates of usage of computers and the Internet among people with disabilities is complicated by the existence of different ways of defining disability. Moreover, disability identification is based on self-reporting, so people with similar conditions may disagree about whether a particular condition constitutes a disability. The approach used by this report is to follow a concept similar to that set out in the Americans with Disabilities Act (ADA). While the Act does not specify all the possible conditions to which ADA protection applies, it does define a person with a disability to be one who has a physical or mental impairment that substantially limits one or more major life activities.(18) Because information on many types of disabilities are collected in the SIPP, it is possible to construct a group that approximates the class protected under the ADA. The group designated as the group with disabilities for the purposes of this study is defined in Box III-2.(19)
It is obvious that any categorization of those with disabilities, including the one detailed here, will encompass a very diverse group of individuals who will differ from each other in almost as many ways as they differ from those outside the group. Even given this extreme heterogeneity, it may be useful to explore how the class protected by the ADA varies from the rest of the population in its members' use of technologies such as computers and the Internet. This aggregate, however, masks the possible differences that may exist among people with different types of disabilities. Therefore, in order to explore the rates at which individuals with different types of disabilities have access to the Internet and use computers, this section also considers populations with five specific disabilities: difficulty walking (i.e., uses a cane, crutches, or wheelchair), vision problems, hearing problems, difficulty using hands, and learning disabilities.
The SIPP questions relating to Internet and computer use were asked of persons age 16 and above. Between August and November 1999, when the disability and Internet and computer use questions were asked, the U.S. population for those 16 and over was estimated to be approximately 209 million with 45 million (21.8%) having at least one of the disabilities in Box III-2. Although the number of persons with any specific disability is not large on a proportional basis, even the smallest group--those with a learning disability--has close to 3 million people (Table III-1).(20)
Disability Status of Persons 16 and Above, 1999
| Number in Thousands | Percent of Population | |
| Total Population 16 and over | 208,783 | |
| Has any Disability | 45,416 | 21.8% |
| Has Difficulty with Walking | 9,209 | 4.4% |
| Has Vision Problems | 7,310 | 3.5% |
| Has Hearing Problems | 6,961 | 3.3% |
| Has Difficulty using Hands | 6,272 | 3.0% |
| Has a Learning Disability | 2,945 | 1.4% |
Source: Survey on Income and Program Participation, research data file (August -November 1999, Wave 11), U.S. Census Bureau, U.S. Department of Commerce.
Therefore, persons with a disability could answer "yes" to Internet access at home, even if they themselves never used it. As was noted in Part II, a quarter of people in homes with Internet access do not actually use that access. This survey's results, therefore, most likely overstate the rate of Internet use by those with and without disabilities. The degree of overstatement may also be larger for those with disabilities and vary by particular types of disabilities.
As shown in Figure III-1, persons with a disability were only half as likely to have Internet access either from home or some other location than those without any disability. There were, however, differences in rates of access for specific disabilities. Those with a learning disability, for example, are more like the population with no disability than are those with a vision problems in having access to the Internet.(21)
While the SIPP did not question respondents about computer ownership, respondents were asked about their experience using personal computers. As shown in Figure III-2, one half (51%) of those without a disability use "a personal computer on a regular basis" and an additional quarter of this group responded that they have "used a personal computer, but do[es] not now use one on a regular basis." Only 25% of the group without disabilities has never used a personal computer. The situation is quite different for those who have a disability. Those with learning disabilities are the only group with a disability where at least half of the population has any experience using a personal computer.
EXPLORING POPULATIONS WITH DISABILITIES
While some of the results presented above have plausible explanations, others raise more questions than answers. One could hypothesize, for example, that the lower rates of PC use at work by those with a disability reflect lower employment among that group, that software that relies heavily on "mouse" commands makes computer use difficult for those with manual dexterity problems, or that Web pages that are covered with graphics make it difficult for people with vision problems to navigate a site. Why, then, do those who use crutches, canes, or wheelchairs have a similarly low proportions of people accessing the Internet or using a PC regularly as those, say, with vision impairment? In order to better understand the use of computers and the Internet by those with disabilities, further examination of the composition of the various groups is necessary.
People with a disability (again using the criteria set in Box III-2) are somewhat more likely to be female than the population without disabilities, and there are some relatively minor differences in race and ethnicity distributions between the two groups (see Table III-7). When it comes to income, age, and employment distributions, however, there are striking diferences: the group with disabilities has lower income, is older, and is less likely to be employed than the group without disabilities (see Figures III-4 to III-9). The previous sections of this report show these three variables to be associated with substantial variations in computer use and Internet access. And, indeed, some interesting variations are found in rates of Internet access and regular computer use between disabled and nondisabled populations when considered over these dimensions, as well as gender and race/ethnicity.
As shown in Figure III-10, people with a disability are less likely to have access to the Internet than people without a disability at all income levels. This disparity between the two groups declines as income rises. For example, a person with a disability is less than half as likely to have home Internet access if family income is less than $25,000, while there is less than a 20% differential in access rates where family income is in the $75,000 and above range. Similarly, Figure III-11 shows that the difference between the percentage of people with disabilities who regularly use a PC and the percentage of people without a disability who regularly use a PC narrows as incomes rise.(22)
Individuals in younger age groups are more similar in their degree of home Internet access whether or not they have a disability, but the disparity rises as age increases. Figure III-14 shows that those with a disability in the 16-24 year old age range have Internet access at a rate that is nearly 90% of the rate of those without a disability. The disparity between the two groups increases with age, reaching almost 50% in the 65 and over age group. A similar type of pattern holds when considering the differences that exist between persons with and without disabilities in their experience with personal computers across age groups (see Figure III-15).
The following charts (Figures III-16 and III-17) consider disability status by employment status.(23)
As noted in Figures III-8 and III-9, the majority of individuals with a disability are not employed
(67.8%). When we compare home Internet access rates and regular use of PCs between those with
disabilities and those without, controlling for employment status, we find employed persons in the
two groups are substantially more similar than are the non-employed groups. For example,
employed persons with a disability have home Internet access at a rate that is 78.3% of that for the
group with no disabilities, while among the non-employed, the access rate of people with disabilities
is only 46.6% of that of the group with no disabilities.
As shown in Figure III-18, males with or without disabilities are more likely than females in the comparable populations to have Internet access at home. Further, the difference between the group with disabilities and the group without disabilities is larger for women than for men (48% to 55%, respectively). This variation is even more pronounced in the comparison of the proportion of persons who regularly use a PC; even though a slightly higher proportion of women without a disability regularly use a PC, women with a disability lag men with a disability in this category (see Figure III-19).
Population Distribution by Age and Disability, 1999
| 16-24 | 25-49 | 50-64 | 65 and older | |||||
| No Disability | Has A Disability | No Disability | Has A Disability | No Disability | Has A Disability | No Disability | Has A Disability | |
| Population
(in thousands) |
31,282 | 2,960 | 88,557 | 13,885 | 27,932 | 11,604 | 15,596 | 16,966 |
| Population Distribution | 91.4 | 8.6 | 86.4 | 13.6 | 70.6 | 29.4 | 47.9 | 52.1 |
| Male | 50.0 | 52.9 | 49.5 | 47.6 | 49.6 | 44.4 | 46.7 | 38.5 |
| Female | 50.0 | 47.1 | 50.5 | 52.4 | 50.4 | 55.6 | 53.3 | 61.5 |
| White | 64.9 | 66.4 | 71.9 | 68.8 | 81.3 | 73.9 | 86.4 | 80.8 |
| Black | 14.0 | 18.2 | 11.7 | 16.3 | 8.0 | 13.5 | 6.5 | 9.6 |
| Asian Amer. & Pac. Isl. | 4.3 | 1.4 | 3.9 | 2.5 | 3.0 | 2.5 | 2.2 | 2.5 |
| Hispanic | 15.7 | 10.9 | 11.7 | 10.7 | 7.1 | 8.8 | 4.6 | 6.1 |
| Employed | 59.6 | 43.2 | 86.9 | 54.9 | 80.3 | 38.4 | 21.5 | 7.5 |
| Not Employed | 40.4 | 56.8 | 13.1 | 45.1 | 19.7 | 61.6 | 78.5 | 92.5 |
| Less than $25,000 | 27.4 | 38.5 | 20.3 | 42.6 | 18.7 | 41.4 | 44.9 | 60.1 |
| $25,000 - $49,999 | 25.5 | 26.0 | 31.2 | 29.1 | 27.5 | 29.2 | 32.6 | 25.8 |
| $50,000 - $74,999 | 20.0 | 15.1 | 22.9 | 15.9 | 22.7 | 16.6 | 12.7 | 8.2 |
| $75,000 and above | 27.1 | 20.4 | 25.6 | 12.4 | 31.1 | 12.8 | 9.8 | 5.9 |
| Not a High School Graduate | 9.5 | 21.3 | 11.3 | 29.8 | 24.7 | 40.6 | ||
| High School Graduate | 30.3 | 37.0 | 31.8 | 33.4 | 36.5 | 30.8 | ||
| Some College | 31.2 | 28.5 | 27.7 | 23.6 | 21.3 | 17.9 | ||
| College Graduate | 28.9 | 13.2 | 29.2 | 13.2 | 17.5 | 10.7 | ||
Source: Survey on Income and Program Participation, research data file (August -November 1999, Wave 11), U.S. Bureau of the Census, U.S. Department of Commerce.
Note: Educational attainment not reported for 16-24 year olds in this table because over 50% of this age group are full-time students. Therefore, reporting educational attainment for this group would combine the 24 year olds who dropped out of school in the tenth grade with the 16 year old tenth graders�not a meaningful aggregation.
ACCESS, USE, AND DISABILITY: 16-24 YEAR OLDS
This youngest of the age groups for which SIPP computer use and Internet access data are available has the highest rates of Internet and computer use, and members of this age group are least likely to have a disability. Of the population with a disability, just under 3 million fall into the 16-24 year old range, limiting the amount of disaggregation that can be presented for this age group. Of the specific disabilities considered in this report, only learning disabilities had a sample size sufficient to produce reliable results. Those with learning disabilities make up 2.8% of the population in this age group, while the other disabilities of difficulty walking, seeing, hearing, and using one's hands each make up less than 1% of this population group.
Although 16-24 year olds with disabilities have lower rates of Internet access and are less likely to have used a PC, the differences between people who have a disability and people who do not are much smaller than for the entire 16 and over population (Figures III-20 and III-21). Table III-3 shows how Internet access and PC use vary across several sets of characteristics. Of special note is the fact that Internet access is the same for people who have a disability and are employed, as for people who do not have a disability and are employed. A separate breakout of educational attainment is not included for this age group because over half of the people in this age category are full-time students.
Reporting educational attainment, therefore, for this group would combine the 24 year olds who dropped out of school in the tenth grade with the 16 year old tenth graders�not a meaningful aggregation.
Internet Access and Computer Use by 16-24 Year Olds, 1999
(Population: 34,242,000)
| Home Internet Access | Internet Access, But Not At Home | Regular PC User | Never Used a PC | ||||||
| No Disability | Has a Disability | No Disability | Has a Disability | No Disability | Has a Disability | No Disability | Has a Disability | ||
| All 16-24 Year Olds | 41.4 | 35.9 | 20.6 | 17.1 | 57.6 | 39.5 | 9.4 | 21.6 | |
| Male | 41.5 | 34.8 | 19.4 | 15.1 | 54.8 | 35.5 | 10.1 | 22.6 | |
| Female | 41.2 | 37.1 | 21.9 | 19.2 | 60.3 | 44.0 | 8.8 | 20.5 | |
| White | 50.0 | 44.7 | 20.1 | 16.0 | 64.4 | 46.5 | 5.6 | 16.2 | |
| Black | 22.8 | 23.5 | 41.1 | 23.4 | 16.8 | 35.8 | |||
| Asian Amer. & Pac. Isl. | 48.3 | 20.1 | 69.0 | 5.4 | |||||
| Hispanic | 21.6 | 20.2 | 41.6 | 30.8 | 18.6 | 31.3 | |||
| Employed | 44.4 | 43.4 | 19.8 | 19.6 | 59.1 | 48.8 | 8.0 | 10.9 | |
| Not Employed | 36.9 | 30.1 | 21.9 | 15.1 | 55.3 | 32.4 | 11.5 | 29.7 | |
| Less than $25,000 | 24.6 | 25.0 | 23.4 | 19.5 | 42.6 | 28.6 | 14.7 | 27.7 | |
| $25,000 - $49,999 | 35.7 | 32.8 | 23.0 | 17.8 | 55.1 | 37.5 | 10.4 | 22.3 | |
| $50,000 - $74,999 | 46.3 | 19.2 | 63.2 | 8.1 | 16.4 | ||||
| $75,000 and above | 60.0 | 57.4 | 16.6 | 14.1 | 70.8 | 59.2 | 4.2 | 13.1 | |
| Full-Time Students | 49.1 | 43.0 | 24.5 | 19.8 | 69.1 | 50.2 | 4.5 | 16.6 | |
Source: Survey on Income and Program Participation, research data file (August -November 1999, Wave 11), U.S. Bureau of the Census, U.S. Department of Commerce.
Note: Blank cells in the table indicate insufficient sample size to produce reliable estimates.
ACCESS, USE, AND DISABILITY: 25-49 YEAR OLDS
Although data presented in Part II indicate that the proportion of individuals using the Internet
remains relatively constant over every age in this grouping, there are substantial differences in access
and use when considered across characteristics such as income and educational attainment (see Table III-4).
For example, college graduates in the 25-49 year old age group had very similar rates of home
Internet access regardless of disability status (67.8% for those with no disability and 65.2% for those
with a disability). In addition, there are differences among the people with various disabilities within
this group. Those with hearing difficulties had an Internet access rate of 52.7%,roughly
halfway
between the 61.6% rate for those without a disability and the rates in the low 40s for those with other
disabilities.
This age group has the highest proportion employed of any age group considered here and although the proportion employed on a full-time basis among those with no disabilities (86.9%) exceeds the proportion of those with a disability who are likewise employed (54.9%), there are sufficient numbers in both groups to take a detailed look at variations by disability status. As shown in Figures III-24 and III-25, differences in Internet access and computer use are less when considering only those in each group who were employed on a full-time basis(24).
Internet Access and Computer Use by 25-49 Year Olds, 1999
(Population: 102,442,000)
| Home Internet Access | Internet Access, But Not At Home | Regular PC User | Never Used a PC | ||||||
| No Disabil-ity | Has a Disabil-ity | No Disabil-ity | Has a Disabil-ity | No Disabil-ity | Has a Disabil-ity | No Disabil-ity | Has a Disabil-ity | ||
| All 25-49 Year Olds | 46.6 | 31.4 | 15.0 | 10.5 | 55.9 | 33.3 | 18.9 | 39.5 | |
| Male | 47.3 | 31.6 | 13.1 | 8.3 | 54.4 | 33.2 | 21.0 | 43.3 | |
| Female | 46.0 | 31.2 | 16.9 | 12.5 | 57.4 | 33.5 | 16.8 | 36.1 | |
| White | 53.6 | 37.1 | 15.6 | 11.4 | 62.42 | 39.0 | 12.5 | 32.6 | |
| Black | 27.4 | 14.8 | 17.4 | 9.2 | 41.8 | 17.8 | 28.2 | 58.6 | |
| Asian Amer. & Pac. Isl. | 49.9 | 12.2 | 53.9 | 32.8 | 23.2 | 40.0 | |||
| Hispanic | 23.3 | 18.6 | 9.8 | 6.8 | 31.6 | 21.1 | 47.2 | 54.4 | |
| Employed | 47.3 | 39.4 | 16.3 | 15.2 | 58.3 | 45.7 | 17.1 | 26.3 | |
| Not Employed | 42.4 | 21.6 | 6.5 | 4.8 | 40.3 | 18.3 | 30.6 | 55.7 | |
| Less than $25,000 | 27.7 | 16.9 | 12.4 | 7.7 | 36.5 | 18.0 | 34.6 | 52.9 | |
| $25,000 - $49,999 | 39.0 | 33.6 | 17.5 | 12.1 | 51.2 | 38.1 | 21.4 | 34.8 | |
| $50,000 - $74,999 | 53.3 | 44.5 | 14.7 | 12.9 | 61.8 | 45.9 | 13.2 | 28.5 | |
| $75,000 and above | 64.9 | 59.1 | 14.4 | 13.3 | 71.8 | 58.3 | 8.5 | 19.2 | |
| Not a High School Graduate | 12.2 | 9.4 | 3.8 | 4.0 | 13.6 | 8.9 | 64.0 | 74.8 | |
| High School Graduate | 34.1 | 24.5 | 12.9 | 8.4 | 39.9 | 24.0 | 27.2 | 43.6 | |
| Some College | 49.7 | 41.2 | 17.0 | 15.2 | 60.7 | 45.5 | 11.4 | 22.8 | |
| College Graduate | 67.8 | 65.2 | 18.8 | 16.9 | 81.5 | 72.6 | 3.3 | 7.2 | |
Source: Survey on Income and Program Participation, research data file (August -November 1999, Wave 11), U.S. Bureau of the Census, U.S. Department of Commerce.
Note: Blank cells in the table indicate insufficient sample size to produce reliable estimates.
ACCESS, USE, AND DISABILITY: 50-64 YEAR OLDS
Among the 50 to 64 year old age group, 30% have at least one of the disabilities listed in Box III-2 and the proportion with any one of the five disabilities considered, with the exception of learning disabilities, is also substantially higher than in the 25-49 year old group. This is an age group that has wide variations in Internet access and computer use within the group of people who have disabilities. For example, 70.9% of those who have a disability and have family income of less than $25,000 have never used a PC. That proportion falls to 29.7% in the $75,000 and above income group.
Internet Access and Computer Use by 50-64 Year Olds, 1999
(Population: 39,536,000)
| Home Internet Access | Internet Access, But Not At Home | Regular PC User | Never Used a PC | ||||||
| No Disability | Has a Disability | No Disability | Has a Disability | No Disability | Has a Disability | No Disability | Has a Disability | ||
| All 50-64 Year Olds | 42 .5 | 24.0 | 12.6 | 7.2 | 48.1 | 23.3 | 28.9 | 55.5 | |
| Male | 45.1 | 25.2 | 11.2 | 7.6 | 48.7 | 23.5 | 30.2 | 56.4 | |
| Female | 39.9 | 23.0 | 13.9 | 6.8 | 47.5 | 23.1 | 27.7 | 54.8 | |
| White | 46.6 | 28.2 | 13.2 | 7.8 | 52.8 | 26.8 | 23.8 | 50.4 | |
| Black | 23.8 | 10.0 | 11.5 | 7.1 | 31.0 | 14.9 | 45.8 | 66.9 | |
| Asian Amer. & Pac. Isl. | 34.2 | 10.4 | 31.8 | 46.8 | |||||
| Hispanic | 20.6 | 7.2 | 21.3 | 10.2 | 61.4 | 77.3 | |||
| Employed | 44.2 | 32.8 | 14.8 | 14.3 | 52.6 | 39.9 | 25.6 | 36.8 | |
| Not Employed | 35.5 | 18.5 | 3.8 | 2.7 | 29.6 | 12.9 | 42.7 | 67.2 | |
| Less than $25,000 | 23.6 | 12.2 | 10.5 | 4.2 | 28.1 | 10.9 | 47.3 | 70.9 | |
| $25,000 - $49,999 | 31.2 | 23.9 | 12.6 | 8.3 | 40.7 | 24.8 | 34.6 | 52.6 | |
| $50,000 - $74,999 | 46.5 | 30.5 | 12.9 | 10.7 | 51.5 | 33.8 | 25.2 | 42.3 | |
| $75,000 and above | 60.8 | 54.2 | 13.6 | 9.6 | 64.1 | 46.3 | 15.6 | 29.7 | |
| Not a High School Graduate | 13.6 | 7.4 | 4.0 | 1.8 | 11.4 | 5.8 | 73.6 | 83.5 | |
| High School Graduate | 30.6 | 17.6 | 11.9 | 7.1 | 34.0 | 17.3 | 39.8 | 59.4 | |
| Some College | 45.7 | 39.4 | 13.7 | 10.7 | 52.1 | 38.6 | 19.4 | 33.6 | |
| College Graduate | 63.6 | 50.2 | 15.6 | 13.2 | 73.8 | 50.4 | 8.9 | 21.7 | |
Source: Survey on Income and Program Participation, research data file (August -November 1999, Wave 11), U.S. Bureau of the Census, U.S. Department of Commerce.
Note: Blank cells in the table indicate insufficient sample size to produce reliable estimates.
ACCESS, USE, AND DISABILITY: 65 YEAR OLDS AND OLDER
Internet Access and Computer Use by 65 Year Olds and Older, 1999
(Population: 4,221,000)
| Home Internet Access | Internet Access, But Not At Home | Regular PC User | Never Used a PC | ||||||
| No Disability | Has a Disability | No Disability | Has a Disability | No Disability | Has a Disability | No Disability | Has a Disability | ||
| All 65 and Older | 17.4 | 9.3 | 3.7 | 1.8 | 15.1 | 5.7 | 66.6 | 83.8 | |
| Male | 20.2 | 12.5 | 3.9 | 1.9 | 19.7 | 7.6 | 63.0 | 79.8 | |
| Female | 15.0 | 7.4 | 3.5 | 1.8 | 11.0 | 4.5 | 69.8 | 86.3 | |
| White | 18.6 | 10.4 | 3.7 | 2.0 | 16.2 | 6.6 | 64.7 | 81.6 | |
| Black | |||||||||
| Asian Amer. & Pac. Isl. | |||||||||
| Hispanic | |||||||||
| Employed | 24.6 | 9.8 | 28.4 | 19.2 | 52.1 | 64.2 | |||
| Not Employed | 15.5 | 8.8 | 2.0 | 1.6 | 11.4 | 4.6 | 70.6 | 85.4 | |
| Less than $25,000 | 9.1 | 4.1 | 2.8 | 1.1 | 7.9 | 2.9 | 78.9 | 89.6 | |
| $25,000 - $49,999 | 18.0 | 13.0 | 3.1 | 2.6 | 18.2 | 8.2 | 59.5 | 78.1 | |
| $50,000 - $74,999 | 31.3 | 5.5 | 22.7 | 12.3 | 52.8 | 69.0 | |||
| $75,000 and above | 36.1 | 7.3 | 27.3 | 13.8 | 51.9 | 70.8 | |||
| Not a High School Graduate | 5.3 | 1.6 | 3.5 | 1.7 | 87.6 | 94.4 | |||
| High School Graduate | 12.5 | 9.0 | 3.0 | 1.6 | 10.2 | 4.5 | 72.1 | 84.1 | |
| Some College | 23.8 | 13.4 | 5.2 | 3.1 | 20.2 | 8.9 | 56.3 | 73.7 | |
| College Graduate | 37.1 | 23.8 | 6.3 | 4.9 | 35.4 | 19.4 | 38.1 | 59.8 | |
Source: Survey on Income and Program Participation, research data file (August -November 1999, Wave 11), U.S. Bureau of the Census, U.S. Department of Commerce.
Note: Blank cells in the table indicate insufficient sample size to produce reliable estimates.
Individuals 16 and over, 1999
(Numbers in Thousands)
|
Total Population |
Persons without a Disability |
Persons with a Disability | ||||
| Number | Percent | Number | Percent | Number | Percent | |
| TOTAL | 208,783 | 163,367 | 78.2 | 45,416 | 21.8 | |
| GENDER | ||||||
| Male | 100,449 | 48.1 | 80,580 | 49.3 | 19,869 | 43.7 |
| Female | 108,334 | 51.9 | 82,787 | 50.7 | 25,547 | 56.3 |
| AGE | ||||||
| 16 to 24 | 34,241 | 16.4 | 31,282 | 19.1 | 2,960 | 6.5 |
| 25 to 49 | 102,442 | 49.1 | 88,557 | 54.2 | 13,885 | 30.6 |
| 50 to 64 | 39,536 | 18.9 | 27,932 | 17.1 | 11,604 | 25.5 |
| 65 + | 32,563 | 15.6 | 15,596 | 9.6 | 16,996 | 37.4 |
| FAMILY INCOME | ||||||
| Less than $25,000 | 60,767 | 29.1 | 38,723 | 23.7 | 22,045 | 48.5 |
| $25,000 to $49,999 | 60,976 | 29.2 | 48,405 | 29.6 | 12,571 | 27.7 |
| $50,000 to $74,999 | 40,868 | 19.6 | 34,892 | 21.4 | 5,976 | 13.2 |
| $75,000 or more | 46,170 | 22.1 | 41,347 | 25.3 | 4,824 | 10.6 |
| EMPLOYMENT STATUS | ||||||
| Employed | 136,030 | 65.2 | 121,398 | 74.3 | 14,632 | 32.2 |
| Not Employed | 72,753 | 34.8 | 41,969 | 25.7 | 30,784 | 67.8 |
| RACE/ETHNICITY | ||||||
| White | 154,011 | 73.8 | 120,203 | 73.6 | 33,808 | 74.4 |
| Black | 24,004 | 11.5 | 18,000 | 11.0 | 6,004 | 13.2 |
| Asian Amer. & Pac. Isl. | 7,089 | 3.4 | 5,984 | 3.7 | 1,105 | 2.4 |
| Hispanic | 21,836 | 10.5 | 17,965 | 11.0 | 3,871 | 8.5 |
Source: Survey on Income and Program Participation, research data file (August -November 1999, Wave 11), U.S. Bureau of the Census, U.S. Department of Commerce.
Internet Access and Computer Use, 1999
(Population: 208,784,000)
| Home Internet Access | Internet Access, But Not At Home | Regular PC User | Never Used a PC | ||||||
| No Disability | Has a Disability | No Disability | Has a Disability | No Disability | Has a Disability | No Disability | Has a Disability | ||
| All Persons 16 and Above | 42.1 | 21.6 | 14.6 | 6.8 | 51.0 | 20.8 | 23.3 | 59.0 | |
| Male | 43.3 | 23.9 | 13.2 | 6.6 | 50.3 | 22.5 | 24.2 | 57.1 | |
| Female | 41.0 | 19.7 | 16.0 | 7.1 | 51.6 | 19.6 | 22.5 | 60.5 | |
| 16-24 year olds | 41.4 | 35.9 | 20.6 | 17.0 | 57.6 | 39.5 | 9.4 | 21.6 | |
| 25-49 year olds | 46.6 | 31.4 | 15.0 | 10.5 | 55.9 | 33.3 | 18.9 | 39.5 | |
| 50-64 year olds | 42.5 | 24.0 | 12.6 | 7.2 | 47.1 | 23.3 | 28.9 | 55.5 | |
| 65 and older | 17.5 | 9.3 | 3.7 | 1.8 | 15.1 | 5.7 | 66.6 | 83.8 | |
| White | 47.7 | 24.4 | 14.6 | 7.0 | 55.8 | 23.2 | 19.3 | 56.0 | |
| Black | 24.7 | 10.1 | 17.4 | 7.8 | 38.3 | 13.2 | 30.5 | 68.1 | |
| Asian Amer. & Pac. Isl. | 45.9 | 23.4 | 13.4 | 51.8 | 16.6 | 25.2 | 67.2 | ||
| Hispanic | 21.9 | 14.6 | 12.0 | 4.8 | 32.2 | 13.9 | 42.3 | 69.1 | |
| Less than $25,000 | 23.1 | 10.4 | 12.8 | 4.5 | 31.6 | 10.0 | 39.9 | 72.5 | |
| $25,000 - $49,999 | 35.0 | 23.8 | 16.1 | 8.1 | 46.7 | 24.1 | 25.7 | 53.9 | |
| $50,000 - $74,999 | 49.6 | 34.2 | 14.6 | 10.1 | 57.9 | 34.0 | 16.7 | 41.5 | |
| $75,000 and above | 62.0 | 51.3 | 14.4 | 10.3 | 68.3 | 45.4 | 10.7 | 32.5 | |
Source: Survey on Income and Program Participation, research data file (August -November 1999, Wave 11), U.S. Bureau of the Census, U.S. Department of Commerce.
Note: Blank cells in the table indicate insufficient sample size to produce reliable estimates.
Disability by Age,1999
(percent)
| 16-24 | 25-49 | 50-64
|
65 and above
| |
| No Disability | 91.4 | 86.4 | 70.6 | 47.9 |
| Has a Disability | 8.6 | 13.6 | 29.4 | 52.1 |
| Difficulty Walking | 0.4 | 1.4 | 4.8 | 17.7 |
| Difficulty Seeing | 0.5 | 1.7 | 4.1 | 11.4 |
| Difficulty Hearing | 0.7 | 1.3 | 3.7 | 12.0 |
| Difficulty Grasping | 0.3 | 1.5 | 4.0 | 9.4 |
| Learning Disability | 2.8 | 1.4 | 1.1 | 0.5 |
Source: Survey on Income and Program Participation, research data file (August -November 1999, Wave 11), U.S. Bureau of the Census, U.S. Department of Commerce.
More and more Americans have computers and use the Internet. If current trends continue, we expect more than half of all U.S. households will be connected to the Internet by the end of 2000, and more than half of all individuals will be using the Internet by the middle of 2001. We are approaching the point where not having access to these tools is likely to put an individual at a competitive disadvantage and in a position of being a less-than-full participant in the digital economy. Most groups, regardless of income, education, race or ethnicity, location, age, or gender are making dramatic gains. Nevertheless, some large divides still exist and groups are going online at different rates.
The detailed information in this report provides a basis against which we can measure change. We have good data on household access as well as on individual access and use. The latter data will become increasingly important as Americans access the Internet not only from their homes, but also from new hand-held and mobile devices. And, for the first time, we now have information on the use of the Internet by people with disabilities, as well as new technologies such as broadband services. These data can help policymakers focus policies and programs to promote inclusion in using computers and the Internet. Our next survey, to be conducted in September 2001, will give us fresh results and a new opportunity to measure progress.
The nation is rapidly going online, with an ever higher share of Americans regularly using computers and the Internet in their daily lives. The U.S. Department of Commerce will continue to work vigorously to better measure, understand, and promote the goal of full digital inclusion for all Americans.
This report is the fourth in the Department of Commerce's Falling Through the Net series, that surveys trends in Americans' access to new technologies.(25) As in our previous reports, we utilize data from the Department of Commerce's U.S. Census Bureau. The household data in Part I (including the category of high speed internet access), and the individual access and usage data in Part II, of this report come from the Census Bureau's August 2000 Current Population Survey (CPS) of approximately 48,000 sample households. For the first time in this series, we also report on access to new technologies by people with disabilities (in Part III), using data from the Census Bureau's Survey of Income and Program Participation (SIPP).
In collecting household and individual data for the CPS, the Census Bureau interviewed approximately 48,000 sample households. These households were selected from the 1990 Decennial Census files continually updated to account for new residential construction after 1990. The CPS sample is representative of all fifty states and the District of Columbia.
For each household, Census Bureau interviewers spoke to a person (called the "respondent") who was at least 15 years old and was considered knowledgeable about everyone in the household. The respondent provided information for the entire household including the demographics (such as education level, race, and age) of each household member and the income level for the household. The "householder" or "reference person" is an adult in the household who either owns or has signed for the rent on the residence. The respondent provided responses for him or herself and proxy responses for all other members of that household. The survey, therefore, provided information on 121,745 individuals (including children).
As in the prior three reports, the Census Bureau cross-tabulated the information gathered from the CPS according to specific variables, such as income, race, education level, household type, and age as well as by geographic categories, such as rural, urban, and central city, plus state and region. The Census Bureau determined that some of the data were statistically insignificant for meaningful analysis because the sample from which they were derived was too small.
All statistics are subject to sampling error, as well as non-sampling error such as survey design flaws, respondent classification and reporting errors, data processing mistakes and undercoverage. The Census Bureau has taken steps to minimize errors in the form of quality control and edit procedures to reduce errors made by respondents, coders, and interviewers. Ratio estimation to independent age-race-sex-Hispanic population controls partially corrects for bias attributable to survey undercoverage. However, biases exist in the estimates when missed people have characteristics different from those of interviewed people in the same age-race-sex-Hispanic group.
SURVEY OF INCOME AND PROGRAM PARTICIPATION
Information on people with disabilities was gathered from the SIPP, sponsored and conducted by the Census Bureau. This survey is a continuous series of national panels, with sample size ranging from approximately 11,500 to 36,700 interviewed households. The duration of each panel ranges from 2 � years to 4 years. The SIPP sample is a multistage-stratified sample of the U.S. civilian noninstitutionalized population. The 4-year panel containing the disability data was introduced in April 1996.
To facilitate field procedures, each sample panel is divided into four random subsamples, each representative of the Nation, called "rotation groups." Each rotation group is interviewed in a separate month. Four rotation groups thus comprise one cycle or wave of interviewing for the entire panel. At each interview, respondents are asked to provide information covering the 4 months since the previous interview. This 4-month span is the "reference period" for the interview.
The SIPP content is built around a "core" of labor force, program participation, and income questions designed to measure the economic situation of persons in the United States. These questions expand the data currently available on the distribution of cash and noncash income and are repeated at each interviewing wave. Census Bureau field representatives conduct the interviews by telephone and by personal visit using laptop computers.
The survey has been designed also to provide a broader context for analysis by adding questions on a variety of topics not covered in the core section. These questions are labeled "topical modules" and are assigned to particular interviewing waves of the survey. Topics covered by the modules include personal history, child care, wealth, program eligibility, child support, disability, school enrollment, taxes, and annual income. Wave 11 conducted between August and November 1999 contained a topical module on adult disability to which questions of Internet access and computer use were added. This module can be found at http://www.sipp.census.gov/sipp/top_mod/1996/quests/wave11/adultdis.html.
SIPP estimates are subject to errors of two different kinds: sampling error, or errors due to the fact that the results from the SIPP sample may differ from those that might have been obtained if the entire population had been surveyed (i.e., if a census had been taken); and nonsampling errors, or errors due to undercoverage and nonresponse, and errors made during data collection and processing.
APPENDIX TABLE 1-Reasons for discontinuing home Internet use, by selected characteristics
of reference person, Total, Urban, Rural, Central City, 2000
(Numbers in Thousands) Total USA
|
TOTAL |
CAN USE ---ELSEWHERE--- |
COST, TOO ---EXPENSIVE---- |
NOT ENOUGH TIME
----TO USE IT----- |
----NOT USEFUL---- | NOT USER
-----FRIENDLY---- |
PROBLEMS WITH
-SERVICE PROVIDER- |
|||||||
| HHLDS | No. | % | No. | % | No. | % | No. | % | No. | % | No. | % | |
|
All Households
|
3,953 | 504 | 12.76 | 487 | 12.33 | 395 | 10.01 | 166 | 4.20 | 60 | 1.52 | 115 | 2.91 |
| FAMILY INCOME | |||||||||||||
| Under $5,000 | 74 | 16 | 22.18 | 19 | 25.09 | 3 | 3.96 | 4 | 5.29 | 0 | 0.00 | 0 | 0.00 |
| 5,000-9,999 | 183 | 7 | 3.81 | 22 | 12.05 | 17 | 9.47 | 6 | 3.14 | 0 | 0.00 | 5 | 2.68 |
| 10,000-14,999 | 211 | 18 | 8.54 | 29 | 13.50 | 12 | 5.85 | 4 | 1.71 | 8 | 3.94 | 0 | 0.00 |
| 15,000-19,999 | 192 | 26 | 13.66 | 30 | 15.59 | 12 | 6.29 | 10 | 5.38 | 3 | 1.32 | 7 | 3.66 |
| 20,000-24,999 | 269 | 25 | 9.44 | 49 | 18.41 | 11 | 4.12 | 14 | 5.24 | 2 | 0.78 | 2 | 0.86 |
| 25,000-34,999 | 600 | 62 | 10.28 | 55 | 9.14 | 72 | 12.07 | 29 | 4.75 | 9 | 1.46 | 26 | 4.27 |
| 35,000-49,999 | 636 | 60 | 9.44 | 80 | 12.59 | 66 | 10.34 | 21 | 3.29 | 12 | 1.87 | 19 | 3.03 |
| 50,000-74,999 | 697 | 105 | 15.10 | 69 | 9.89 | 98 | 14.05 | 50 | 7.12 | 6 | 0.92 | 17 | 2.42 |
| 75,000+ | 612 | 137 | 22.42 | 46 | 7.52 | 63 | 10.32 | 19 | 3.10 | 6 | 0.94 | 25 | 4.13 |
|
Not reported
|
480 | 47 | 9.89 | 89 | 18.55 | 41 | 8.45 | 10 | 2.15 | 14 | 3.01 | 14 | 2.88 |
| AGE | |||||||||||||
| Under 25 years | 479 | 66 | 13.71 | 53 | 11.11 | 22 | 4.50 | 16 | 3.40 | 0 | 0.00 | 11 | 2.29 |
| 25-34 years | 1,102 | 189 | 17.15 | 124 | 11.28 | 140 | 12.70 | 29 | 2.60 | 15 | 1.39 | 24 | 2.17 |
| 35-44 years | 1,117 | 125 | 11.14 | 156 | 13.99 | 126 | 11.25 | 48 | 4.32 | 8 | 0.68 | 43 | 3.87 |
| 45-54 years | 696 | 70 | 10.09 | 96 | 13.74 | 39 | 5.56 | 34 | 4.93 | 8 | 1,13 | 20 | 2.90 |
|
55+ years
|
559 | 55 | 9.87 | 58 | 10.35 | 70 | 12.45 | 38 | 6.87 | 29 | 5.26 | 17 | 3.00 |
| RACE | |||||||||||||
| White Not Hispanic | 3,156 | 400 | 12.66 | 379 | 12.02 | 309 | 9.79 | 140 | 4.43 | 51 | 1.61 | 83 | 2.64 |
| Black Not Hispanic | 347 | 36 | 10.35 | 55 | 15.80 | 35 | 9.96 | 17 | 4.91 | 6 | 1.66 | 13 | 3.89 |
| AIEA Not Hispanic | 26 | 0 | 1.67 | 10 | 38.32 | 3 | 12.93 | 0 | 0.00 | 0 | 0.00 | 1 | 3.64 |
|
Hispanic
|
303 | 57 | 18.76 | 32 | 10.44 | 33 | 10.86 | 6 | 2.02 | 4 | 1.19 | 11 | 3.74 |
| GENDER | |||||||||||||
| Male | 2,142 | 259 | 12.09 | 275 | 12.86 | 246 | 11.47 | 93 | 4.36 | 41 | 1.93 | 62 | 2.91 |
|
Female
|
1,811 | 246 | 13.56 | 212 | 11.70 | 150 | 8.28 | 73 | 4.01 | 19 | 1.04 | 53 | 2.91 |
| EDUCATIONAL ATTAINMENT | |||||||||||||
| Elementary: 0-8 years | 56 | 3 | 5.47 | 8 | 14.66 | 3 | 5.23 | 0 | 0.00 | 3 | 5.64 | 3 | 5.72 |
| Some H.S.: no diploma | 222 | 19 | 8.61 | 40 | 17.88 | 14 | 6.38 | 10 | 4.70 | 4 | 1.84 | 5 | 2.05 |
| H.S. Diploma/GED | 1,250 | 91 | 7.25 | 210 | 16.79 | 141 | 11.29 | 57 | 4.57 | 22 | 1.75 | 36 | 2.88 |
| Some College | 1,242 | 114 | 9.14 | 131 | 10.55 | 157 | 12.64 | 47 | 3.75 | 11 | 0.92 | 35 | 2.83 |
|
Bachelors degree or more
|
1,183 | 278 | 23.51 | 98 | 8.32 | 80 | 6.79 | 52 | 4.37 | 20 | 1.66 | 36 | 3.05 |
| HOUSEHOLD TYPE | |||||||||||||
| Mar Couple w/Child<18 | 1,180 | 103 | 8.70 | 197 | 16.67 | 173 | 14.67 | 51 | 4.32 | 19 | 1.57 | 36 | 3.07 |
| Male Hhldr w/Child<18 | 101 | 11 | 10.56 | 13 | 13.29 | 6 | 6.24 | 2 | 2.01 | 7 | 7.09 | 3 | 3.10 |
| Female Hhldr w/Child<18 | 506 | 34 | 6.72 | 77 | 15.18 | 41 | 8.18 | 17 | 3.41 | 4 | 0.80 | 17 | 3.35 |
| Family Hhld w/o Child<18 | 784 | 113 | 14.48 | 79 | 10.05 | 83 | 10.57 | 20 | 2.58 | 19 | 2.47 | 21 | 2.69 |
|
Non-family Households
|
1,382 | 244 | 17.62 | 122 | 8.79 | 92 | 6.65 | 75 | 5.46 | 11 | 0.80 | 38 | 2.73 |
| EMPLOYMENT | |||||||||||||
| Employed | 3,194 | 433 | 13.56 | 372 | 11.65 | 352 | 11.02 | 110 | 3.45 | 34 | 1.07 | 88 | 2.76 |
APPENDIX TABLE 1-Reasons for discontinuing home Internet use, by selected characteristics
of reference person, Total, Urban, Rural, Central City, 2000
(Numbers in Thousands) Total USA
|
CONCERN WITH ---CHILDREN----- |
DON'T -----WANT IT------ |
NO LONGER
--OWNS COMPUTER--- |
----MOVED--- | COMPUTER
-REQUIRES REPAIR-- |
COMPUTER WITH
-CAPACITY ISSUES-- |
---OTHER---- | ||||||||
| No. | % | No. | % | No. | % | No. | % | No. | % | No. | % | No. | % | |
|
All Households
|
89 | 2.26 | 406 | 10.26 | 671 | 16.96 | 243 | 6.14 | 383 | 9.70 | 46 | 1.16 | 387 | 9.79 |
| FAMILY INCOME | ||||||||||||||
| Under $5,000 | 0 | 0.00 | 3 | 3.60 | 17 | 23.36 | 8 | 10.65 | 4 | 4.78 | 0 | 0.00 | 1 | 1.08 |
| 5,000-9,999 | 2 | 1.17 | 11 | 6.08 | 61 | 33.30 | 21 | 11.70 | 14 | 7.82 | 0 | 0.00 | 16 | 8.76 |
| 10,000-14,999 | 3 | 1.18 | 21 | 10.06 | 57 | 26.83 | 26 | 12.11 | 24 | 11.41 | 0 | 0.00 | 10 | 4.87 |
| 15,000-19,999 | 6 | 3.00 | 7 | 3.81 | 36 | 18.59 | 15 | 7.62 | 27 | 14.11 | 3 | 1.60 | 10 | 5.39 |
| 20,000-24,999 | 9 | 3.21 | 16 | 5.96 | 71 | 26.49 | 17 | 6.22 | 33 | 12.22 | 7 | 2.77 | 11 | 4.27 |
| 25,000-34,999 | 19 | 3.14 | 56 | 9.41 | 94 | 15.69 | 33 | 5.55 | 72 | 12.07 | 3 | 0.58 | 70 | 11.59 |
| 35,000-49,999 | 14 | 2.25 | 70 | 11.02 | 132 | 20.83 | 27 | 4.28 | 73 | 11.52 | 8 | 1.28 | 53 | 8.27 |
| 50,000-74,999 | 16 | 2.28 | 70 | 10.06 | 110 | 15.82 | 55 | 7.86 | 40 | 5.75 | 5 | 0.68 | 56 | 8.06 |
| 75,000+ | 19 | 3.12 | 64 | 10.41 | 60 | 9.83 | 32 | 5.31 | 73 | 11.93 | 11 | 1.74 | 57 | 9.24 |
|
Not reported
|
2 | 0.45 | 87 | 18.11 | 32 | 6.68 | 9 | 1.86 | 23 | 4.76 | 8 | 1.72 | 103 | 21.50 |
| AGE | ||||||||||||||
| Under 25 years | 2 | 0.44 | 35 | 7.34 | 104 | 21.70 | 74 | 15.38 | 56 | 11.76 | 0 | 0.00 | 40 | 8.37 |
| 25-34 years | 9 | 0.81 | 81 | 7.34 | 233 | 21.18 | 68 | 6.18 | 73 | 6.62 | 15 | 1.34 | 102 | 9.24 |
| 35-44 years | 52 | 4.68 | 109 | 9.76 | 145 | 12.97 | 57 | 5.08 | 112 | 9.99 | 15 | 1.32 | 122 | 10.94 |
| 45-54 years | 17 | 2.39 | 100 | 14.39 | 108 | 15.44 | 28 | 4.06 | 106 | 15.23 | 12 | 1.66 | 59 | 8.48 |
|
55+ years
|
9 | 1.69 | 80 | 14.38 | 81 | 14.48 | 16 | 2.88 | 36 | 6.52 | 5 | 0.82 | 64 | 11.43 |
| RACE | ||||||||||||||
| White Not Hispanic | 64 | 2.03 | 332 | 10.53 | 564 | 17.89 | 193 | 6.10 | 286 | 9.08 | 38 | 1.19 | 316 | 10.03 |
| Black Not Hispanic | 1 | 0.15 | 33 | 9.56 | 54 | 15.55 | 13 | 3.88 | 42 | 12.02 | 3 | 0.78 | 40 | 11.51 |
| API Not Hispanic | 2 | 1.74 | 19 | 15.89 | 7 | 6.13 | 14 | 11.61 | 19 | 15.33 | 4 | 2.99 | 8 | 6.73 |
|
Hispanic
|
20 | 6.72 | 21 | 6.89 | 44 | 14.40 | 19 | 6.18 | 37 | 12.09 | 2 | 0.61 | 18 | 6.10 |
| GENDER | ||||||||||||||
| Male | 36 | 1.67 | 224 | 10.47 | 291 | 13.58 | 151 | 7.04 | 191 | 8.91 | 25 | 1.18 | 247 | 11.54 |
|
Female
|
54 | 2.95 | 181 | 10.01 | 380 | 20.97 | 92 | 5.08 | 193 | 10.63 | 21 | 1.13 | 140 | 7.72 |
| EDUCATIONAL ATTAINMENT | ||||||||||||||
| Elementary: 0-8 years | 3 | 4.85 | 2 | 4.04 | 16 | 28.48 | 3 | 4.64 | 4 | 6.99 | 1 | 1.46 | 7 | 12.82 |
| Some H.S.: no diploma | 7 | 2.95 | 25 | 11.36 | 45 | 20.42 | 6 | 2.77 | 29 | 12.92 | 4 | 1.85 | 14 | 6.28 |
| H.S. Diploma/GED | 36 | 2.86 | 144 | 11.51 | 202 | 16.14 | 61 | 4.85 | 128 | 10.24 | 16 | 1.29 | 107 | 8.57 |
| Some College | 30 | 2.40 | 117 | 9.41 | 219 | 17.65 | 86 | 6.95 | 143 | 11.50 | 17 | 1.36 | 135 | 10.89 |
|
Bachelors degree or more
|
14 | 1.22 | 117 | 9.91 | 188 | 15.92 | 87 | 7.36 | 80 | 6.76 | 8 | 0.67 | 123 | 10.44 |
| HOUSEHOLD TYPE | ||||||||||||||
| Mar Couple w/Child<18 | 44 | 3.70 | 118 | 9.98 | 98 | 8.34 | 48 | 4.06 | 165 | 13.99 | 21 | 1.76 | 108 | 9.17 |
| Male Hhldr w/Child<18 | 0 | 0.00 | 11 | 11.06 | 25 | 24.87 | 4 | 3.81 | 16 | 15.95 | 0 | 0.00 | 2 | 2.03 |
| Female Hhldr w/Child<18 | 298 | 5.79 | 39 | 7.77 | 117 | 23.06 | 25 | 5.03 | 61 | 12.10 | 4 | 0.70 | 40 | 7.91 |
| Family Hhld w/o Child<18 | 1418 | 1.75 | 95 | 12.09 | 103 | 13.16 | 47 | 6.05 | 77 | 9.78 | 14 | 1.77 | 99 | 12.58 |
|
Non-family Households
|
3 | 0.20 | 143 | 10.32 | 327 | 23.68 | 118 | 8.56 | 64 | 4.66 | 8 | 0.55 | 138 | 10.00 |
| EMPLOYMENT | ||||||||||||||
| Employed | 68 | 2.13 | 322 | 10.09 | 538 | 16.84 | 217 | 6.80 | 306 | 9.57 | 36 | 1.13 | 317 | 9.93 |
1. The share of homes with computer and Internet access represents a widely used gauge of electronic connectivity for a country's population. The three previous reports in the Falling Through the Net series beginning in 1995 have focused on this metric, as have reports done in Australia, Canada, Denmark, Finland, France, Germany, Italy, Japan, Norway, Sweden, and the United Kingdom. This measure is used because, in some cases, data on a household basis are the only data available. As more demographic data on people's access become available, such as those covered in Part II of this report, other metrics can be expected to become more common.
2. Gauging the progress of a given group relative to others with respect to computer and Internet access can be accomplished in several ways. In this report, we have made use of two indicia: percentage-point change and percentage change (expansion rate).
3. As of August 2000, there were an estimated 105 million households in the United States.
4. The "urban" category includes those areas classified as being urbanized (having a population density of at least 1,000 persons per square mile and a total population of at least 50,000) as well as cities, villages, boroughs (except in Alaska and New York), towns (except in the six New England states, New York, and Wisconsin), and other designated census areas having 2,500 or more persons. A "central city" is the largest city within a "metropolitan" area, as defined by the Census Bureau. Additional cities within the metropolitan area can also be classified as central cities if they meet certain employment, population, and employment/residence ratio requirements. All areas not classified by the Census Bureau as urban are defined as rural and generally include places of less than 2,500 persons. About 1/4 of all households were in rural areas in August 2000.
5. In surveys underlying this report, persons of Hispanic origin were determined through self-identification by place of origin or descent. Persons of Hispanic origin are those who indicated that their origin was Mexican-American, Chicano, Mexican, Puerto Rican, Cuban, Central or South American, or other Hispanic. People of Hispanic ethnicity can be of any race. In the tabulations throughout this analysis, people of Hispanic origin are grouped as Hispanic and excluded from the race categories. Throughout this report, "Whites" should be read as "Whites, non-Hispanic" and "Blacks" should be read as "Blacks, non-Hispanic."
6. Although the Census Bureau collected data on household income in $5,000 increments up to $35,000, this report depicts changes in wider income bands. Since the latest ceiling for poverty income is $13,300 for a family of three and $17,000 for a family of four, it seemed appropriate to set the first breakpoint at $15,000.
7. Last month, for the first time in its long-running reports on poverty and income, the Census Bureau did include results for AIAE, but only by pooling the last three years of data collected. We do not have three years of data collected on a comparable basis to produce separate numbers for AIAE. Data for AIAE households can be found, however, in the public use file which can be found at www.ntia.doc.gov, www.esa.doc.gov, and at www.bls.census.gov/cps/ cpsmain.htm.
8. In this shift-share analysis, we used the actual Internet access rates for each of the possible combinations of income and education levels provided in the Census data for Blacks and Hispanics separately. We then calculated what the Internet access rate among Blacks and Hispanics would have been if the share of Blacks and Hispanics in each of the income-education combinations had been the same as the national average.
9. The term "broadband" is used in this study to include the two most common technologies, Digital Subscriber Line (DSL) and cable modems, as well as such technologies as Integrated Services Digital Network (ISDN). These technologies usually feature broadband capabilities although some applications or connections may possess speeds lower than the 200 kilobits per second that the Federal Communications Commission defines as broadband. Although a technology that appears to be on the brink of widespread high-speed capabilities, wireless is more often narrowband in its current applications.
10. Survey respondents who stated that they were online at home were asked whether they accessed the Internet through regular "dial-up" telephone lines or whether they had selected a higher-speed form of connectivity. Where respondents indicated they had obtained a faster connection, they were also asked to identify the type of access used --- Digital Subscriber Lines (DSL), Integrated Services Digital Network (ISDN), cable modems, wireless, or other. Today a relatively small proportion of households access the Internet at higher speeds. The survey results will create an important baseline to measure growth in high speed Internet access. Data relating to speed of Internet access can be found in the Appendix, Figures A15-A22.
11. A separate discussion of the roll out of broadband services is contained in the April, 2000, report Advanced Telecommunications in Rural America: The Challenge of Bringing Broadband Service to All Americans produced by the U.S. Departments of Commerce and Agriculture. That report found DSL and cable modem services are more readily available in urban areas.
12. Educational attainment refers to the highest level of education completed. Data shown exclude individuals age 3 to 24 because a large portion of individuals in these groups are still in school.
13. The labor force includes both the employed and the unemployed (i.e., not employed , but looking for work). Since most of the unemployed move in and out of the employment, they are generally more likely to be employed than those not in the labor force.
14. Reported Internet use from "school (K-12)" and "other school" was lower in August 2000 than in December 1998. The authors believe this is a function of seasonal factors--i.e., students who were not in school in August when the 2000 survey was conducted appear to have influenced the frequency with which "schools (K-12 )" and "other schools" were reported as locations for Internet use. Only August 2000 data are shown. Evidence of this seasonality problem can be seen from the fact that the number of people age 18 to 24 who reported being in school dropped from 14 million in December 1998 to 12 million in August 2000. The next U.S. Bureau of the Census Survey on computer and Internet use is scheduled for September 2001 when data on school use should be less problematic.
15. Internet use rates shown in this section represent a ratio of those individuals engaging in the respective online activities as a share of Internet users who use the Internet at home. In August 2000, 93.8 million people or 35.7% of the population used the Internet at home.
16. Internet use rates shown in this section represent a ratio of those individuals engaging in the respective online activities as a share of Internet users who used the Internet outside the home. In August 2000, 50.9 million people or 19.4 percent of the population used the Internet outside their homes.
17. As with the discussion in Parts I and II, the present analysis simply presents cross-tabulations of survey data. No attempt has been made here to discern causality or even disentangle the complex interactions that exist, for example, between disability status, income, and employment.
18. The ADA, which celebrated its tenth anniversary on July 26, 2000, prohibits discrimination on the basis of disability in employment, state and local government, public accommodations, commercial facilities, transportation, and telecommunications. The Act also includes in its definition any individual with a disability, people with a history or record of such an impairment and people who are perceived by others as having such an impairment.
19. This concept of disability was developed by John McNeil, Bureau of the Census, U.S. Department of Commerce. For additional information on developing an appropriate definition of disability in the context of the SIPP survey see John M. McNeil, "Employment, Earnings, and Disability," presented at 75th Annual Conference of the Western Economic Association International meetings, June 29-July 3, 2000. (www.census.gov/hhes/www/disability.html).
20. An individual may have more than one type of disability.
21. The SIPP data from which these descriptive statistics are drawn are research data for which the analysis required to construct confidence intervals has not yet been undertaken. Therefore it is not possible to judge with accuracy which differences among groups are "real" in the statistical sense. All results and inferences contained in this section should be consider preliminary pending development of testing criteria.
22. The companion figures of "No Internet Access at Home, But Elsewhere" and "Never Used a PC" appear in Table III-8.
23. Note that this section (unlike Part II) groups those who are both unemployed and seeking work with those not in the labor force instead of considering the employed and the unemployed.
24. The data in Figures III-24 and III-25 refer to those who were employed on a full-time basis for the reference period of the survey. Data in Table III-4 and elsewhere refer to people who had any employment (full or part-time) during the reference period to be employed.
25. The first report, Falling Through the Net: A Survey of the "Have Nots" in Rural and Urban America (July 1995), surveyed household telephone, computer, and modem ownership. Falling Through the Net II: New Data on the Digital Divide (July 1998), presented updated data on household access to telephones, computers, and the Internet. Falling Through the Net: Defining the Digital Divide (July 1999) provided new data on household access to these technologies, and also provided new information on individual Internet access and usage.
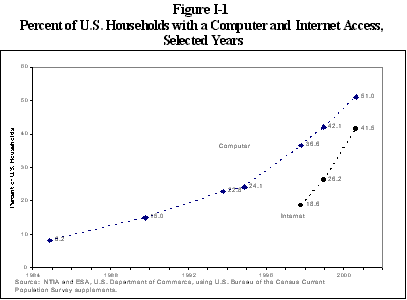
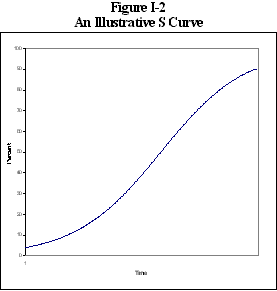
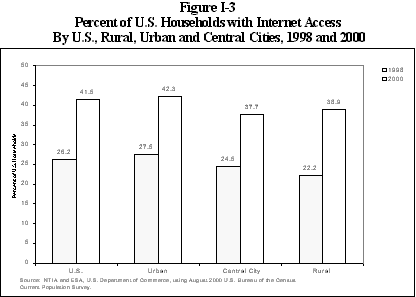
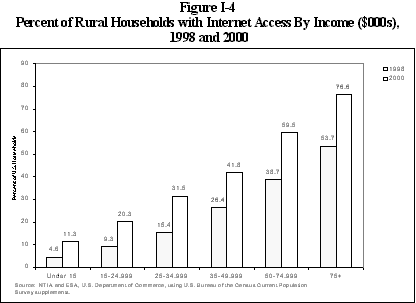
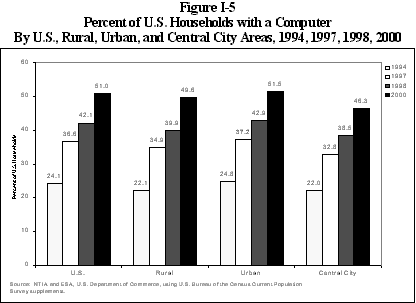
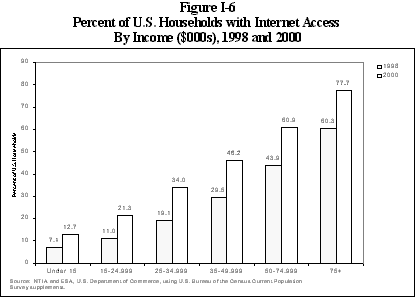
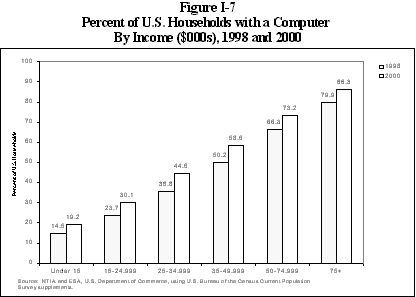
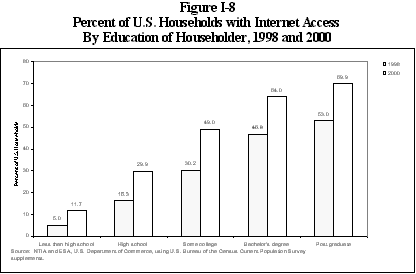
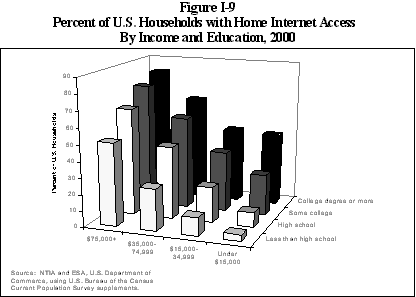
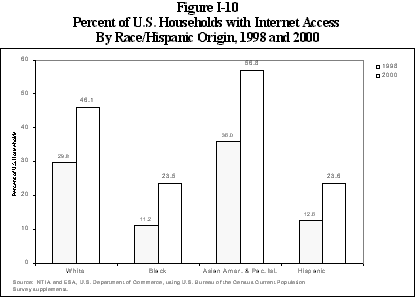
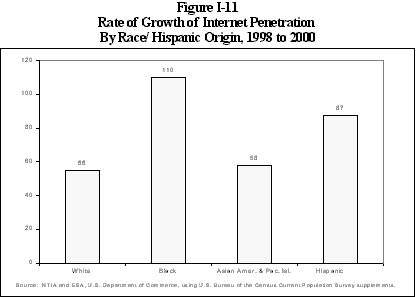
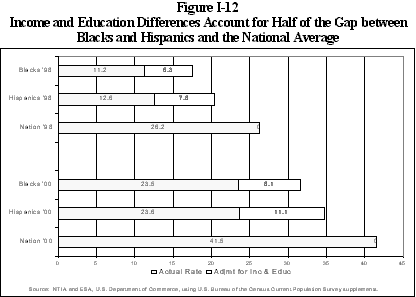
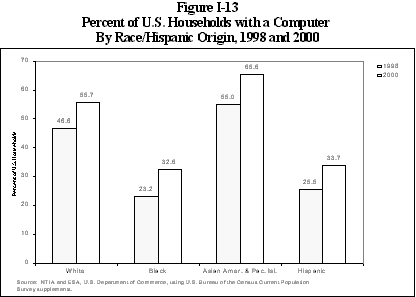
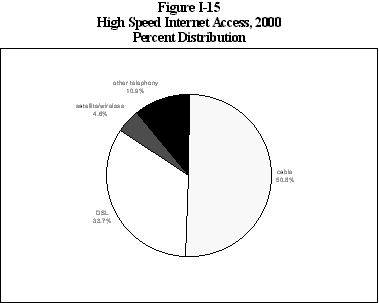
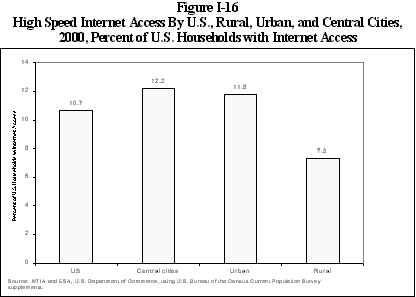
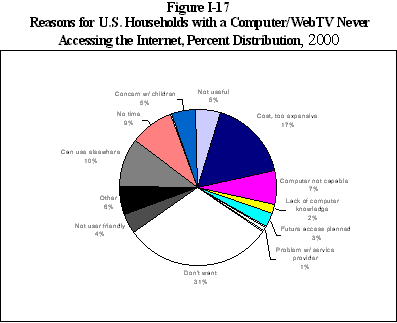
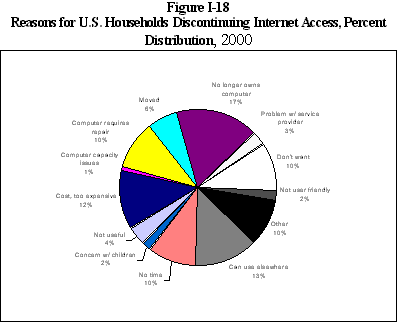
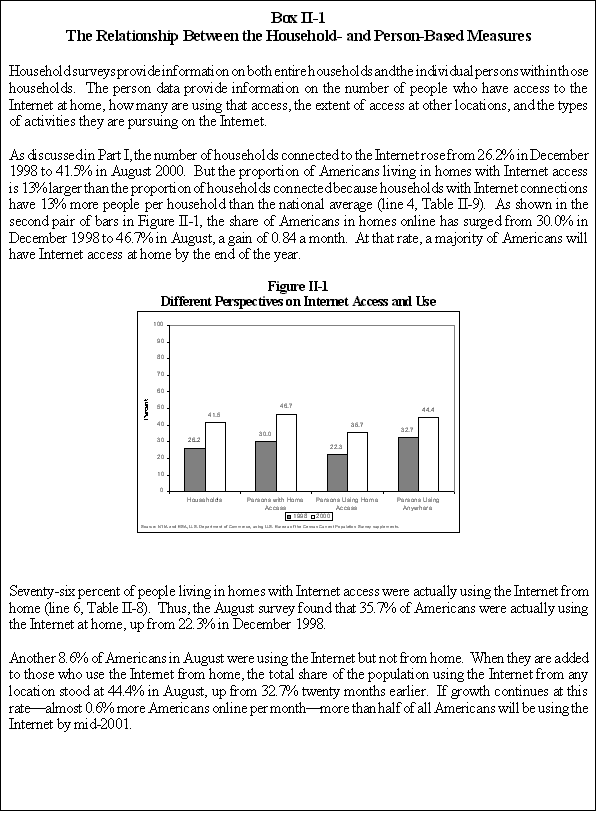
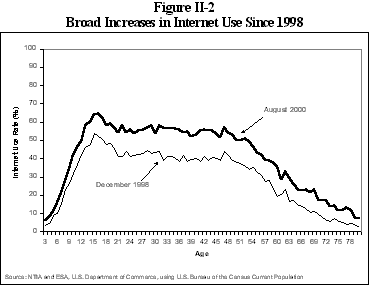
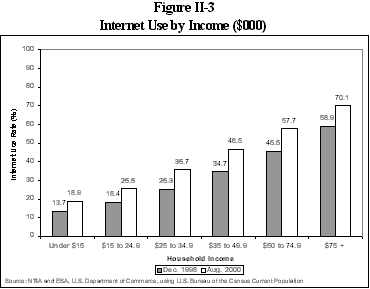
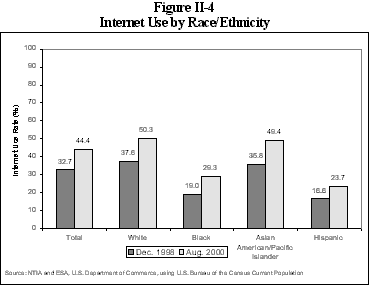
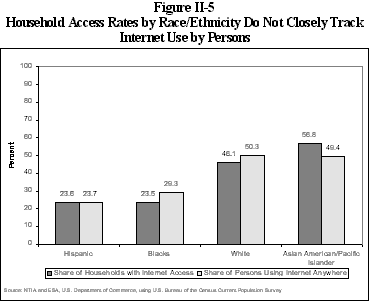
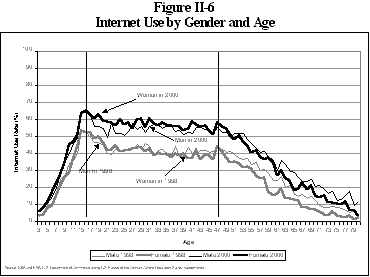
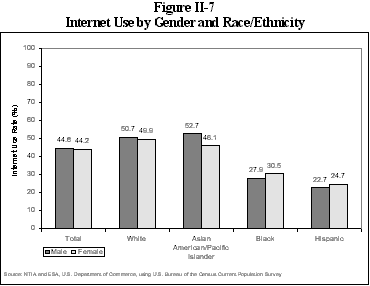
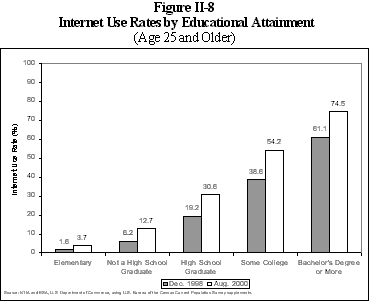
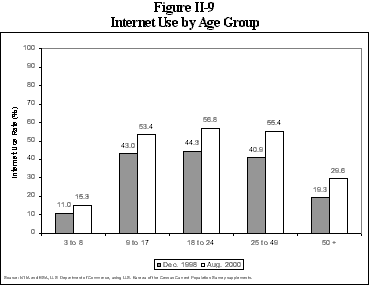
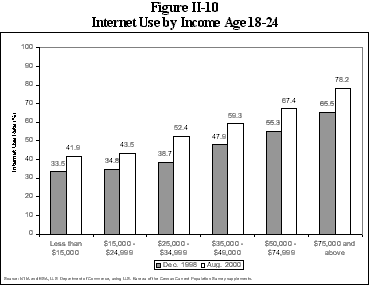
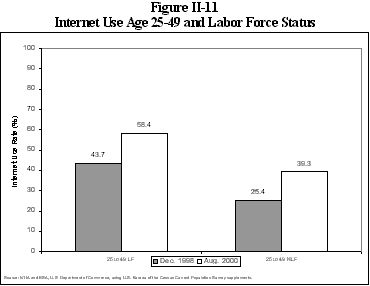
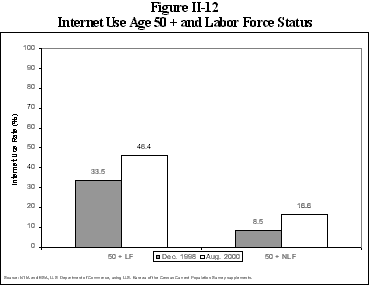
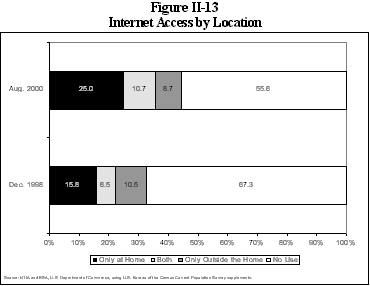
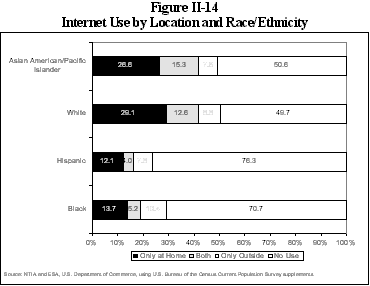
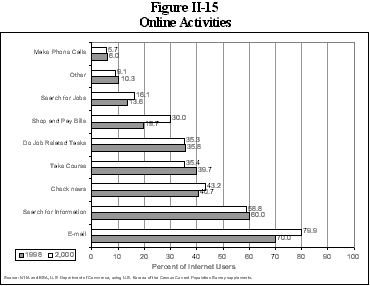
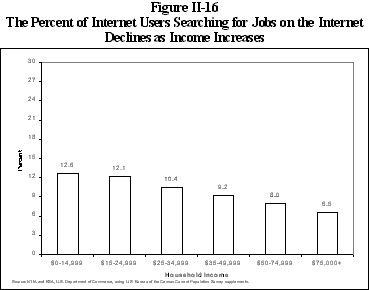
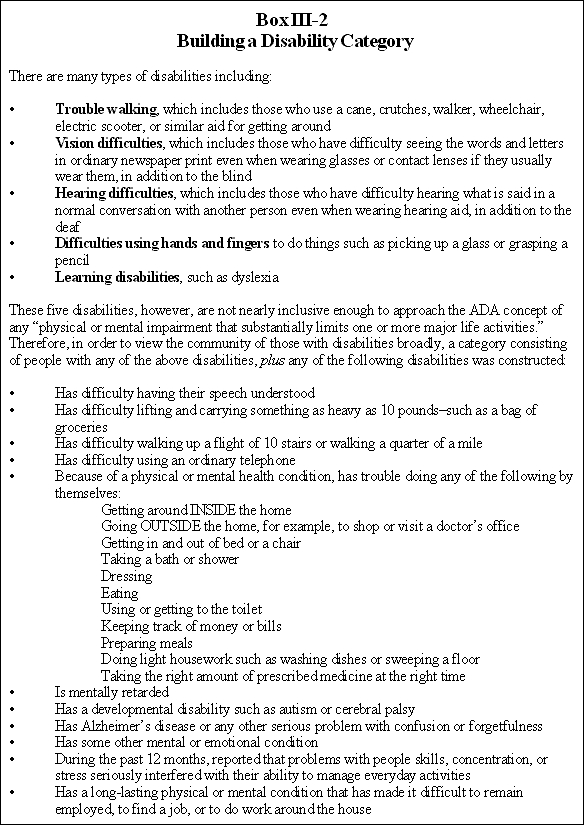
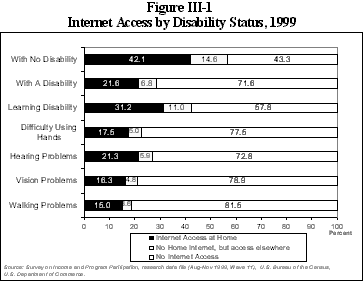
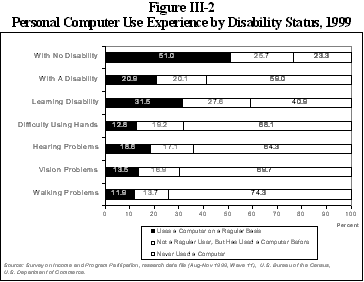
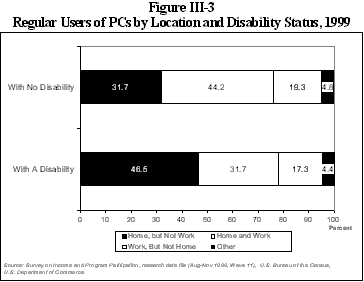
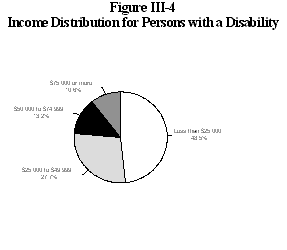 ">
">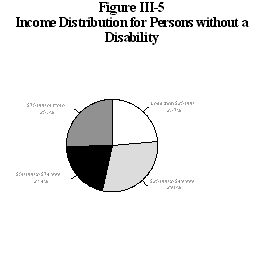 ">
">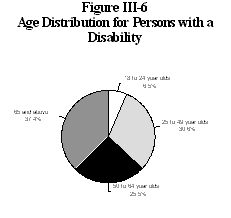 ">
">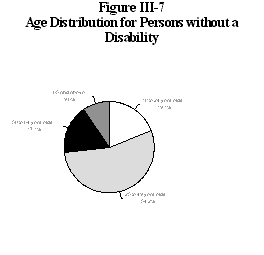 ">
">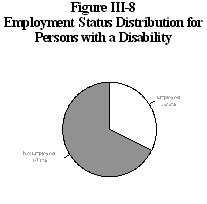 ">
">