
National Broadband Availability Map
NTIA received funding from Congress in 2018 to update the National Broadband Availability Map (NBAM) in coordination with the Federal Communications Commission (FCC). Congress directed NTIA to acquire and utilize data from available third party datasets. NTIA built upon existing partnerships with states and local governments to identify data from state, local and tribal governments, owners and operators of broadband networks, educational institutions, nonprofits, and cooperatives to create the map.
For questions, please email nbam@ntia.gov
Updated Information on Participating States, U.S. Territories, and Federal Agencies:
NTIA’s National Broadband Availability Map (NBAM) includes 39 state participants: Alaska, Arizona, California, Colorado, Connecticut, Florida, Georgia, Hawaii, Idaho, Illinois, Indiana, Kansas, Louisiana, Maine, Maryland, Massachusetts, Michigan, Minnesota, Mississippi, Missouri, Montana, Nebraska, Nevada, New Hampshire, New Mexico, New York, North Carolina, Ohio, Oklahoma, Oregon, South Dakota, Tennessee, Utah, Vermont, Virginia, Washington, West Virginia, Wisconsin, and Wyoming; three U.S. territories: American Samoa, Commonwealth of the Northern Mariana Islands (CNMI), and Puerto Rico; as well as eight federal agencies: Appalachian Regional Commission (ARC), the Bureau of Indian Affairs (BIA), the Economic Development Administration (EDA), Federal Communications Commission (FCC), the Minority Business Development Agency (MBDA), U.S. Census Bureau, U.S. Department of Agriculture (USDA), and U.S. Department of the Treasury.
Related content
NTIA Requests Feedback on Improving Broadband Availability Data
Across the country, Americans use broadband to learn, shop, grow their businesses, and connect with friends and family around the world. Communities that gain access to affordable, high-speed Internet see improvements to economic growth, educational opportunities, and public safety and health care services.
Much of America has been reaping the rewards of broadband for years, but there are still areas of the country that don’t have the connectivity needed to keep up with the modern economy. According to the Federal Communications Commission (FCC), more than 30 percent of rural Americans live in areas that lack broadband availability.
We know these gaps exist, but what we don’t know is precisely which areas of the country have insufficient broadband capacity. That makes it difficult to ensure that public investments in infrastructure are efficient and effective. Right now, the FCC’s Form 477 data, which is collected from broadband service providers, is our only source for nationwide broadband availability information. The Form 477 data program is valuable, but the data is not independently validated or verified. It is also reported at the Census block level, so that can lead to inaccuracies that overstate availability – especially in rural areas where Census blocks are large.
NTIA Recommends Improvements to the FCC’s Broadband Data Collection
National Broadband Map has Helped Chart Broadband Evolution
When NTIA launched the National Broadband Map in 2011, American consumers and businesses had few places to turn to when trying to determine who offered broadband in their communities. The National Broadband Map has not only filled that void but has helped detail the evolution of broadband in the United States as providers upgrade or expand their networks to meet the growing demand for faster broadband.
For the last five years, each state, territory and the District of Columbia has collected the broadband availability data that powers the National Broadband Map with the help of grants funded by NTIA through the 2009 American Recovery and Reinvestment Act. Every six months, states have submitted to NTIA data compiled from information gathered from broadband providers, public and commercial data, consumers and local governments. Today, we are releasing updated broadband map data, current as of June 30, 2014.
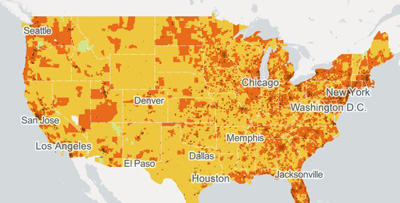
This map displays availability of higher broadband speeds across demographic characteristics